About Procore Insights
Table of Contents
Overview
procore insights availability
Project and Company Insights are now available in all regions for customers on eligible plans with Insights or with purchase of Procore Analytics.Procore Insights help you spot risk early, understand performance trends, and take action with confidence. It's a tool designed to bring the most critical patterns to the surface without guesswork or manual digging. Whether you're managing a single job or overseeing a portfolio, Insights makes the most critical patterns visible.
Key Features:
-
See what matters most: Instantly view project- and company-level insights designed to highlight risk, track performance, and uncover opportunities to improve.
-
Make data-backed decisions: Drive better outcomes by understanding what’s working, what’s not, and how your current performance compares to similar projects.
-
Act on risk before it becomes a problem: With clear call-to-actions, you’ll know where to focus — whether it’s reducing delays, improving quality, or preventing safety issues.
-
Benchmark against the industry: Leverage Procore’s industry-wide dataset to compare your performance to peers and measure progress over time.
-
Gain executive-level visibility: Company-level Insights highlight trends across your portfolio, helping leaders stay ahead of systemic risk and drive strategic action.

Project Insights
RFI Response Time: Show/Hide Insights Features
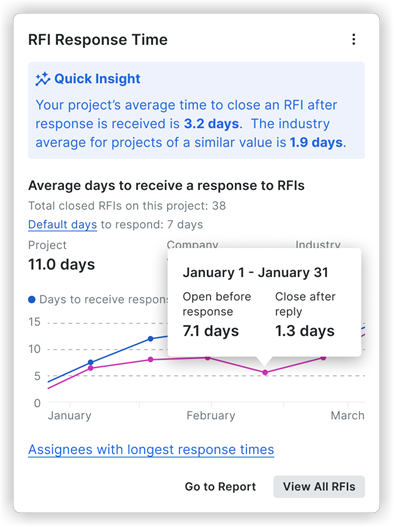
This insight shows the average industry response time for RFIs, your company’s average RFI response time historically based on your past projects, and your current project’s average RFI response time. Additionally, you can see a breakdown of Assignees and their average response time, as well as your current contract requirement for RFI response time. Lastly, the Quick Insight area lets you see the performance of your project against the industry's average response time. See How is Average RFI Response Time calculated?
Submittal Response Time: Show/Hide Insights Features
This insight shows you the average industry response time for submittals based on your project type and size, the company’s average submittal response time historically based on your projects, and your current project’s average submittal response time. Additionally, you can see a breakdown of Assignees and their average response time. Lastly, the Quick Insight area lets you see the performance of your project against the industry's average response time. See How is Submittal Response Time calculated?

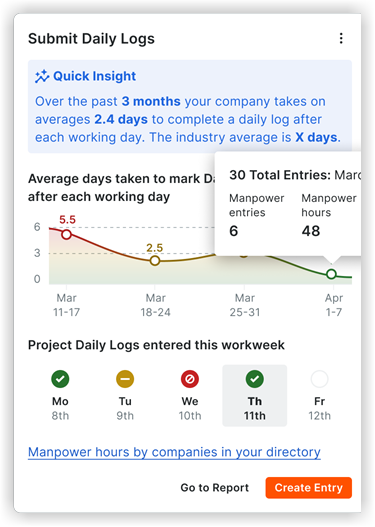
Submit Daily Logs: Show/Hide Insights Features
This insight provides a comprehensive overview of the timeliness and completion of daily logs on your project. From this insight card, you can access a prebuilt Daily Log report or directly navigate to the Daily Log tool to create daily log entries. A data-driven best practice recommendation is also included to empower you to submit a daily log each working day to reduce project risks. See How is the Submit Daily Logs insight calculated?
Note: Weather, photos, and timecard entries are excluded from these metrics.
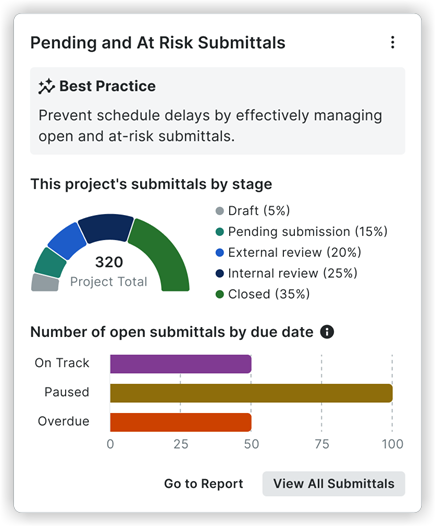
Pending and At Risk Submittals: Show/Hide Insights Features
The Pending and At Risk Submittals insight is designed to provide comprehensive visibility into the status of submittals within a project. This feature empowers you to monitor the progress of your submittals by viewing which are on schedule, which may require intervention, and those at risk of becoming overdue. This insight includes two key sections: submittals by stage and number of submittals by due date.
'This Project's Submittals by Stage' enables users to understand where each submittal currently stands in its lifecycle and helps identify any potential bottlenecks. This section includes five stages:
-
Draft - Submittals that have not yet begun the review workflow.
-
Pending Submission - Submittals that have entered the review workflow and are awaiting action from the 'Submitter.'
-
External Review - Submittals under review by an external approver, such as an architect or engineer.
-
Internal Review - Submittals under review by an internal team member, such as a project manager.
-
Closed - Submittals that have completed the entire workflow and are marked as 'Closed.'
'Number of Submittals by Due Date' categorizes submittals based on their due date status, allowing yours to manage time-sensitive tasks effectively. Section details include the following:
-
On track - 'The Last Step Due Date' is on or before the 'Final Due Date', indicating the submittal is progressing as planned.
-
Paused - The submittal was rejected by an approver and requires attention from the submittal manager to proceed.
-
Overdue -The submittal has exceeded its final due date and remains unclosed.
From this insight, you can view a pre-populated report template that shows details on current submittals, their stages, and the responsible party. You can also go directly to the submittals tool within Procore to take action on pending items or make updates to move submittals to the next stage.
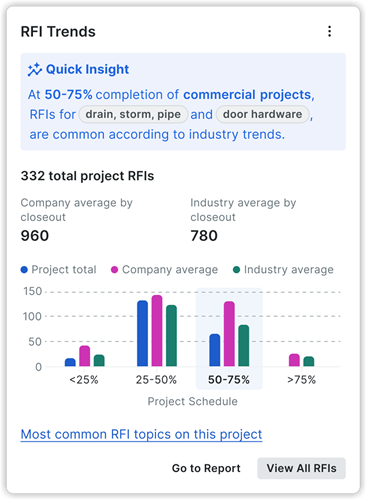
RFI Trends: Show/Hide Insights Features
This provides visibility into the expected count and types of RFIs on your projects based on project size and type. By offering predictive insights, this feature enables you to take proactive measures before issues arise, helping to reduce cost and schedule risks. You will be prompted to update key project details such as Start Date, Completion Date, Project Type, and Total Value to unlock full access to the insight. Additional sections of this insight include:
-
Quick Insight - Displays the two most common RFI topics on the project, based on the specific project type.
-
Values by Closeout - Provides a comparison of predicted RFIs for the project by closeout, the average number of RFIs from past projects, and industry averages for similar projects.
-
Chart view - Visualizes predicted and actual RFI values, broken down into project completion stages (25% increments). You can hover over each stage to view:
-
Completed Stage (25%): Shows the actual two most common RFI topics for the project.
-
Current Stage (25%): Displays both actual RFI topics and industry-wide common topics for similar project types.
-
Upcoming Stages (25% each): Reveals the most common RFI topics across the industry for similar project types.
-
-
Most Common RFI Topics - Provides a link to the top five RFI topics on the project to date, along with the percentage of total RFIs and a trendline showing when these RFIs were most common. You can also click 'Show more' to see all RFI topics and their associated metrics for deeper insights.
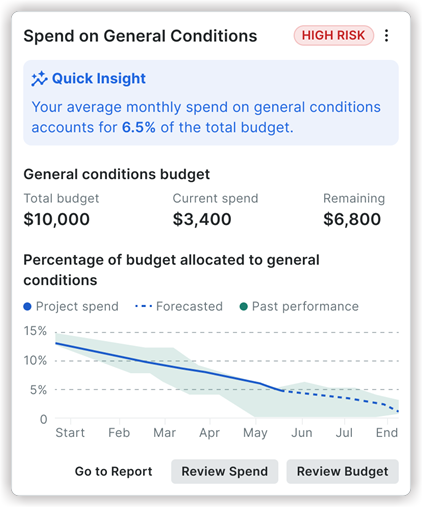
Spend on General Conditions: Show/Hide Insights Features
This Insight offers a broader perspective, allowing companies to understand their general conditions spending trends across multiple projects.
-
Quick Insight: Provides a company-level benchmark such as: "Over the past 4 quarters, general conditions made up an average of 6.5% of each project's budget."
-
Percentage of budget allocated to General Conditions for active projects: A line chart visualizing the trend over the Past 4 quarters and Same time the prior year. Hovering over these displays detailed project and budget metrics for specific months.
-
Forecast availability: Indicates that predictive insights are available for a subset of projects.
-
Actions:
-
Go to Report: Navigates to a company-level report or dashboard related to general conditions spending.
-
Review Spend: Take you to a tear sheet listing projects with financial risk information.
-
-
Risk Tags : Helps users quickly identify and prioritize high-risk areas within their projects. By categorizing insights with High, Medium, or Low risk levels, users can focus on the most critical issues at a glance.
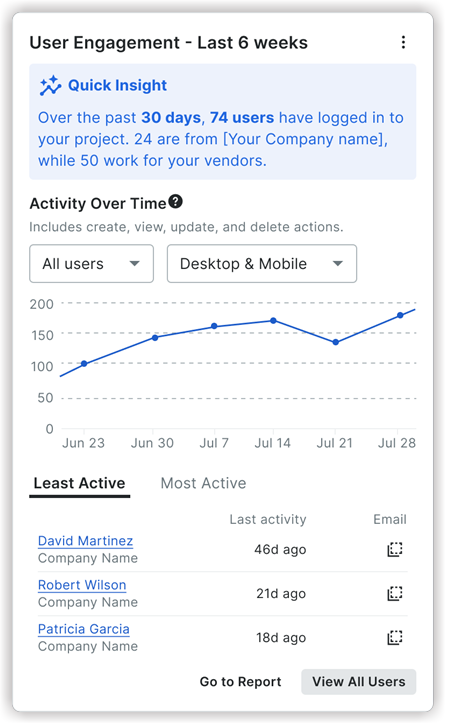
User Engagement: Show/Hide Insights Features
This insight provides visibility into user activity across your projects, highlighting those most engaged. It can also identify users with low engagement, potentially revealing knowledge gaps and opportunities for improvement.
-
Quick Insight: Summarizes user and vendor activity within the project over the past 30 days, highlighting the number of active users from your company and active vendors.
-
Activity Over Time: Total user activity trend line for the past 6 weeks. This data can be filtered by user type (All Users, Company Users, or Vendors) and by device (Desktop & Mobile, Desktop Only, or Mobile Only).
-
Least Active and Most Active: View users by activity level. Choosing Least Active displays users who haven't engaged recently, along with their associated company and the duration since their last activity. Conversely, selecting Most Active reveals the most frequent users, their company, and the Procore tools they utilize most often.
To see a full user activity report, click Go To Report. To view a complete list of all Project users and their activity levels, including the tools they use, click View All Users.
Time to Complete Observations: Show/Hide Insights Features
This insight shows your specific project's average time to close an Observation item. It is designed to help project-level teams identify bottlenecks in their process and see how their project's performance compares to the company average and the industry as a whole.
-
Quick Insight: This section highlights your project's average time to complete Observations for the current month, and compares it to the previous month and the industry average for similar projects.
-
Average days to complete Observations: This section shows a three-way comparison between your project's average, your company's average, and the industry average, with a line graph showing the trend over the last six months.
-
Median days to notify and review: This section breaks down the average time it takes for Observations on the project to be notified and the average time they spend in the "Ready for review" status.
-
Companies with the most Observations: A table that lists the companies or vendors on the project with the highest volume of closed Observations. It includes metrics such as their count of items closed in under 10 minutes, days open to close, and time spent in review.
From this insight, you can navigate to a more detailed report by clicking Go to Report, or go directly to the Observations tool by clicking Review Observations.

Days Without an Incident: Show/Hide Insights Features
This insight tracks the number of consecutive days a specific project has operated without a safety incident. It helps project teams monitor their safety record, stay aware of open incidents, and reinforce safe behaviors on site.
-
Best Practice: This section provides a recommendation to recognize crews for hitting safety streak milestones (e.g., 30, 60, or 90 days).
-
Days since last recordable incident: Shows the total number of days since the last major, recordable incident was logged for this specific project.
-
Days since last any incident: Displays the number of days since any type of incident (including minor ones) was logged for this project.
-
Most recent open incidents: A table that provides a quick view of the most recent open incidents on the project. It lists the Incident ID, Hazard, and Event Date, with links to each item.
To see more data, click Go To Report. To manage the incidents for this project, click View All Incidents to navigate directly to the Incidents tool.

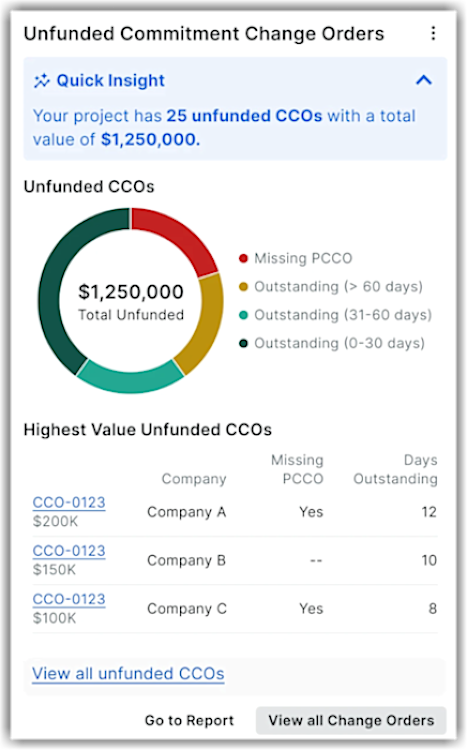
Unfunded Commitment Change Orders (COOs): Show/Hide Insights Features
Provides a visibility into Unfunded Commitment Change Orders (COOs) that have NOT been linked to owner funding (Prime Contract Change Orders (PCCO)). The insight focuses on individual project health, allowing project teams to see specific change orders that risk becoming non-reimbursable costs. It helps you spot and reduce financial risk from COOs that lack a funding source.
Availability and Access: To maintain data security and for proper product entitlement, the following access logic are applicable:
-
Available to users with Procore Analytics and Insights (Cost Management) enabled.
-
Requires the 'View Project Change Order Insights' granular permission enabled on the Project's Insights tool.
-
Available to Change Order Administrators or users with the 'View Project Change Order Insights' granular permission enabled.
At the Project level, the Unfunded Commitment Change Orders insight:
-
Shows a visual aging breakdown (0–30, 31–60, and 60+ days) and a granular table highlighting the highest-value outstanding CCOs and the missing PCCO.
-
Allows you to track aging and See exactly how long unfunded orders have been outstanding.
-
Bridges the gap by automatically linking commitments to prime contracts.
-
Allows you to drill into all unfunded CCOs to see amounts, aging, and creation dates. Use the Highest Value Unfunded CCOs section to prioritize follow‑up.
-
Provides a view of all unfunded CCOs and their impact on a single project. Click View all unfunded CCOs to view additional information of all unfunded CCOs.
-
Helps to prevent unreimbursed work and revenue leakage when CCOs aren’t backed by owner funding.
-
Gives both project teams and executives the visibility needed to protect margins and ensure subcontractors are paid.
To navigate to a more detailed report, click Go to Report. To view all change orders for the project, click View all change orders, or go directly to the Commitments tool to link CCOs to PCCO and clean up exposure.
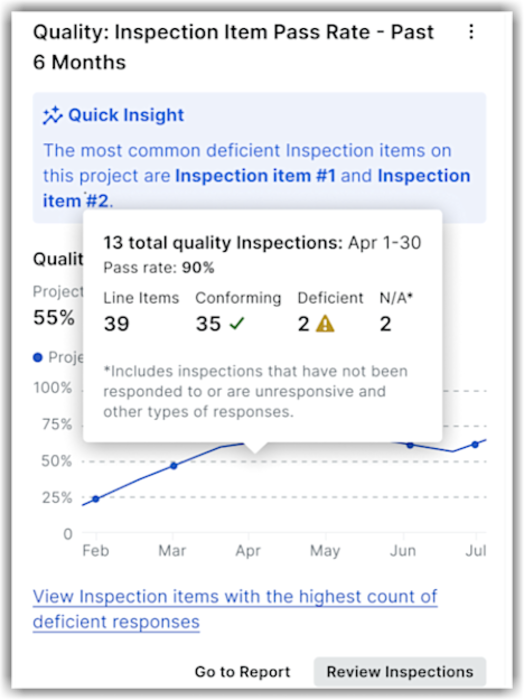
Inspection Item Pass Rate - Past 6 Months: Show/Hide Insights Features
Shows the percentage of inspection line items that pass on the first inspection for a rolling last six months period. The insight measures the health of your project's quality control.
A high first-time pass rate means fewer delays, lower costs, and less rework. By comparing performance with company benchmarks, you can quickly spot patterns, address recurring problems, and improve project quality—saving time, reducing rework, and keeping your projects on track.
Note: To access the project-level Inspection Item Pass Rate insight, users require 'View Project Inspection Insights' granular permission enabled on the project's Inspection tool.
The project-level Inspection Item Pass Rate insight:
-
Shows the average percentage of inspection item conforming pass rate on the first inspection for a project with company as a benchmark. This allows teams to benchmark their performance against peers to adopt best practices, reduce rework, and avoid delays.
-
Provides a rolling last six months view to highlight trends in Conforming versus Deficient items.
-
Displays a snapshot with Quality or Safety in the insight's heading section based on your quality or safety tool breakdown. For example, Quality: Inspection Item Pass Rate - Past 6 Months or Safety: Inspection Item Pass Rate - Past 6 Months.
-
Allows to hover over the line charts to see detailed monthly statistics (total line items, conforming, deficient, N/A). For example, number of inspections items not responded to or unresponsive.
-
Highlights the effectiveness of inspection processes by revealing how often inspections meet requirements on the first attempt at the project level.
-
Allows to drill into inspection items with the highest number of deficient responses. Click View Inspection items with the highest count of deficient responses to identify templates or individual line items that frequently fail so you can target training or process changes.
To navigate directly to reports, click Go to Reports. To view all inspections, click Review Inspections, or go directly to the project's Inspections tool for deeper analysis and follow‑up.
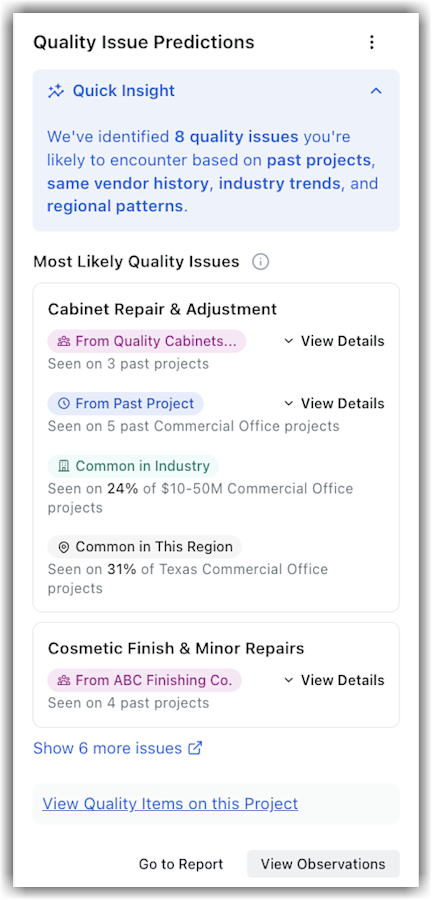
Quality Issue Predictions: Show/Hide Insights Features
Displays the predicted quality issues likely to occur on a project based on historical project data, trade performance, industry benchmarks, and regional patterns, with supporting signals and examples. This new insight is available to enrolled companies with access to the Insights, Observations, Punch List, and Inspections tools.
Note: Users with Admin-level permissions on the Observations or Punch List tools can view this insight. Additionally, those with "View Project Observation Insights" or "View Project Punch Item Insights" granular permissions also have access.
The Quality Issue Predictions insight highlights the top eight quality risks you are likely to encounter for a project. By analyzing your organization's historical projects, vendor performance, industry trends, and regional patterns, it identifies key focus areas—allowing project and quality leaders to align teams and workflows before problems compound. Using this insight data, you can:
-
Get early visibility into probable quality themes for your project, going beyond what has already been logged.
-
Understand why each topic matters by analyzing signals such as past project data, vendor track records, and common trends within your industry cohort and region.
-
Move from insight to action with direct links to explore quality data and reporting in context—such as reports and Observations, consistent with your permissions.
Note: Predictions are intended to support informed planning and should be validated against your project’s scope, contracts, and current conditions. Use them as a supplement to your established quality processes. You should verify for accuracy before operational or contractual decisions.
To view each issue information, click View Details in the corresponding section. Click View Quality Items on this Project to see quality related object details.
Company Insights
Company RFI Response Time: Show/Hide Insights Features
Tracks how long it takes for RFIs to be responded to across all projects. Key metrics include company-wide RFI response time, industry benchmark comparisons, and projects with the longest response times. Users can filter by All Projects, Active, or Inactive projects. The Quick Insight area lets you see the performance of your company against the industry's average response time.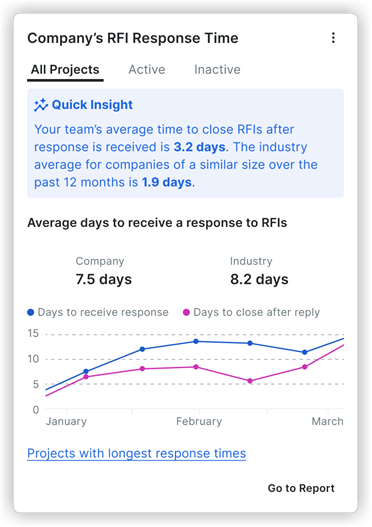
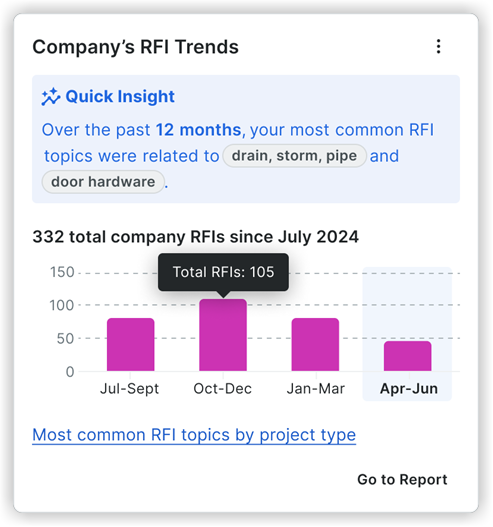
Company RFI Trends: Show/Hide Insights Features
Provides visibility into the quantity and types of RFIs across your project portfolio over the past 12 months. Includes the following key metrics:
Quick Insight: Displays the two most common RFI topics across your projects in the past 12 months.
Chart View: Visualizes RFI counts, broken down into project completion stages (25% increments). Hover over each stage to view the following:
Completed Stage (25%): Shows the actual two most common RFI topics for the project.
Current Stage (25%): Displays both actual and industry-wide common RFI topics for similar project types.
Upcoming Stages (25% each): Reveals the most common RFI topics across the industry for similar project types.
Most Common RFI Topics: Provides a link to your most common RFI topics by project type (sector). Click Show More to see all RFI topics and their associated metrics for deeper insights.
Company Submittal Response Time: Show/Hide Insights Features
Measures how long it takes to respond to submittals across all projects. Key metrics include company-wide submittal response time, industry benchmarks, and projects with the longest response times. Users can filter by All Projects, Active, or Inactive projects. The Quick Insight area lets you see the performance of your company against the industry's average response time.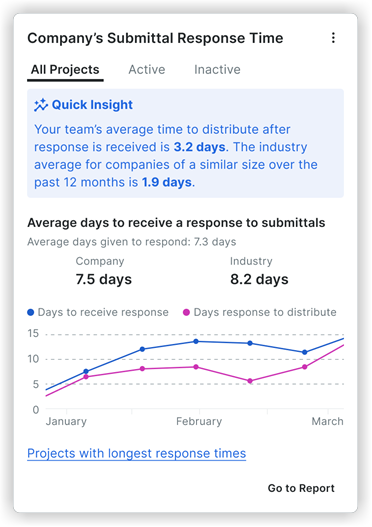
Company Daily Log Completions: Show/Hide Insights Features
Tracks the consistency of Daily Log completion across active projects. Key metrics include average days to complete Daily Logs company-wide, industry benchmarks, and Daily Log completion trends over time. The Quick Insight area lets you see the performance of your company against the industry's average response time.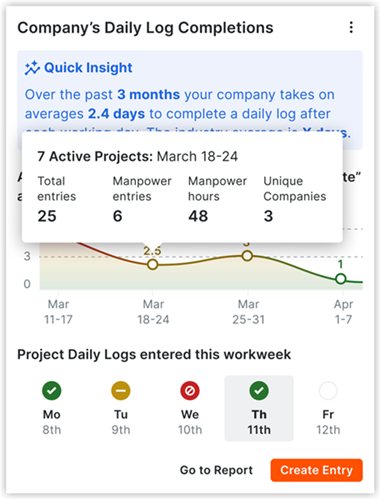
Company Pending and At Risk Submittals: Show/Hide Insights Features
Highlights submittals that are at risk of causing project delays. Key metrics include a breakdown of pending submittals across all active projects, submittal due date status (On Track, At Risk, Overdue), and industry comparisons.
'This Project's Submittals by Stage' enables users to understand where each submittal currently stands in its lifecycle and helps identify any potential bottlenecks. This section includes five stages:
Draft - Submittals that have not yet begun the review workflow.
Pending Submission - Submittals that have entered the review workflow and are awaiting action from the 'Submitter.'
External Review - Submittals under review by an external approver, such as an architect or engineer.
Internal Review - Submittals under review by an internal team member, such as a project manager.
Closed - Submittals that have completed the entire workflow and are marked as 'Closed.'
'Number of Submittals by Due Date' categorizes submittals based on their due date status, allowing yours to manage time-sensitive tasks effectively. Section details include the following:
On track - 'The Last Step Due Date' is on or before the 'Final Due Date', indicating the submittal is progressing as planned.
Paused - The submittal was rejected by an approver and requires attention from the submittal manager to proceed.
Overdue -The submittal has exceeded its final due date and remains unclosed.
From this insight, you can view a pre-populated report template that shows details on current submittals, their stages, and the responsible party. You can also go directly to the submittals tool within Procore to take action on pending items or make updates to move submittals to the next stage. 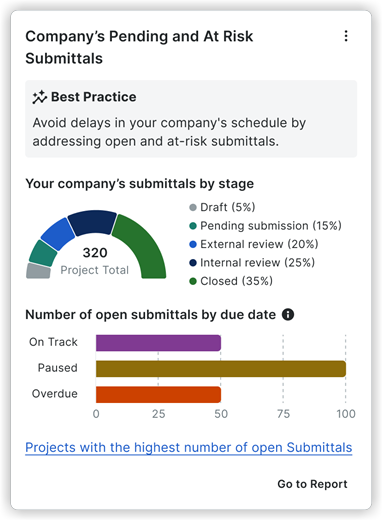
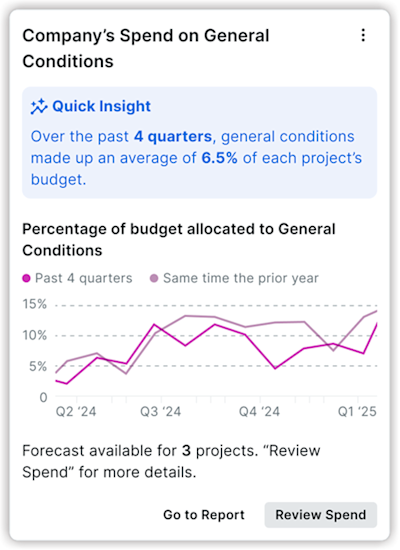
Company Spend on General Conditions: Show/Hide Insights Features
This insight provides a real-time view of a specific project's spending on general conditions against its allocated budget.
Quick Insight: Provides critical benchmark information such as, "General Conditions account for approximately 6.5% of the total budget."
General Conditions Budget: Displays the Budget, Spent, and Remaining core financial figures.
Burn Rate Chart: Visually represents the project's spending trend over time, showing Project spend, Forecasted spend, and Past performance benchmarks. Hovering over the chart displays detailed metrics for specific periods.
Actions:
Review Spend: Directs you to a tear sheet with a detailed breakdown of spending.
Review Budget: Links to the project's budget tool.
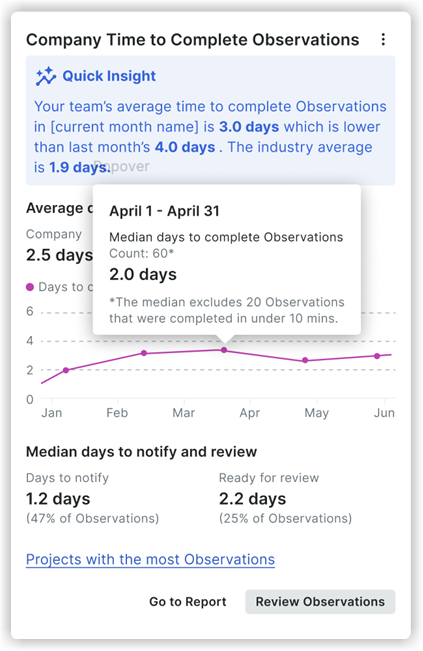
Company Time to Complete Observations: Show/Hide Insights Features
The Company Time to Complete Observations insight shows your team's average time to close an Observation item. This helps you identify potential bottlenecks in the observation resolution process and see how your team's performance compares to the industry average.
Quick Insight: This section highlights your team's average time to complete Observations for the current month, and compares it to the previous month and the industry average.
Average days to complete Observations: This section shows your company's average time to close an Observation and compares it to the industry average, with a line graph showing the trend over the last six months.
Median days to notify and review: This section breaks down the average time it takes for Observations to be notified and the average time they spend in the "Ready for review" status.
Projects with the most Observations: A table that lists the projects with the highest volume of closed Observations, showing metrics such as the number closed in under 10 minutes, days open to close, and time spent in review.
From this insight, you can navigate to a more detailed report by clicking Go to Report, or go directly to the Observations tool by clicking Review Observations.
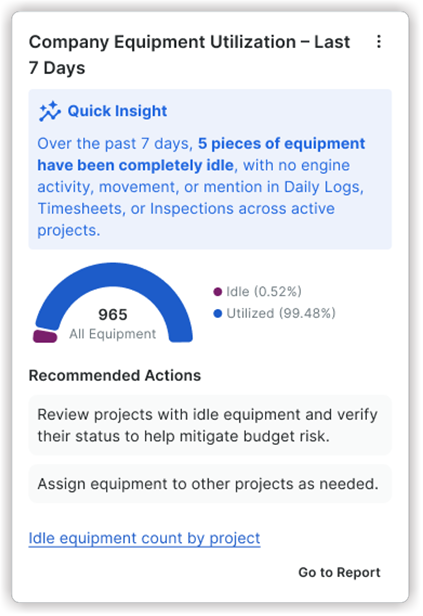
Company Equipment Utilization - Last 7 Days: Show/Hide Insights Features
The Company Equipment insight shows you which of your company's equipment has been sitting idle for the past 7 days. Equipment is considered idle if it has had no engine activity, movement, or mention in Daily Logs, Timesheets, or Inspections across active projects. This insight helps you see which equipment is being underutilized so you can make better decisions about your resource allocation and budget.
Quick Insight: This section provides a summary of the total number of idle equipment over the past 7 days.
Idle vs. Utilized Gauge: A visual representation of the percentage of idle versus utilized equipment across your company.
Idle Equipment List: A table that lists each piece of idle equipment and includes the following information:
Equipment ID
Onsite Project
Last Activity
Last Activity Date
Recommended Actions:
Investigate why the equipment is not being used.
Move idle equipment to projects where it is needed.
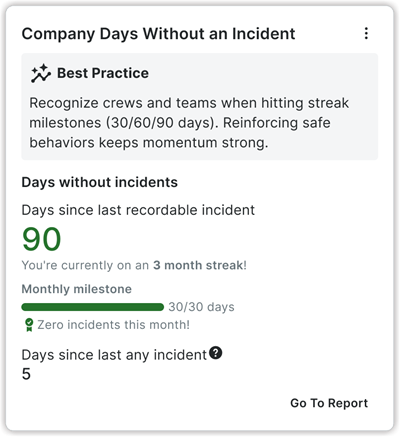
Company Days Without an Incident: Show/Hide Insights Features
The Company Days Without an Incident insight helps you track and promote safety by displaying the consecutive number of days your company has gone without an incident. It helps you monitor your company's safety performance in real-time and recognize teams for maintaining a safe working environment.
Best Practice: This section provides a recommendation to recognize crews for hitting safety streak milestones (e.g., 30, 60, or 90 days) to reinforce safe behaviors.
Days since last recordable incident: Shows the total number of days since the last major, recordable incident was logged. This metric tracks your current streak.
Monthly milestone: A progress bar that tracks the number of incident-free days within the current month.
Days since last any incident: Displays the number of days since any type of incident (including minor ones) was logged.
Projects with the most incidents: This table (not shown on the main card) displays a list of active projects that have the highest count of incidents, allowing you to identify which projects may need additional safety focus.
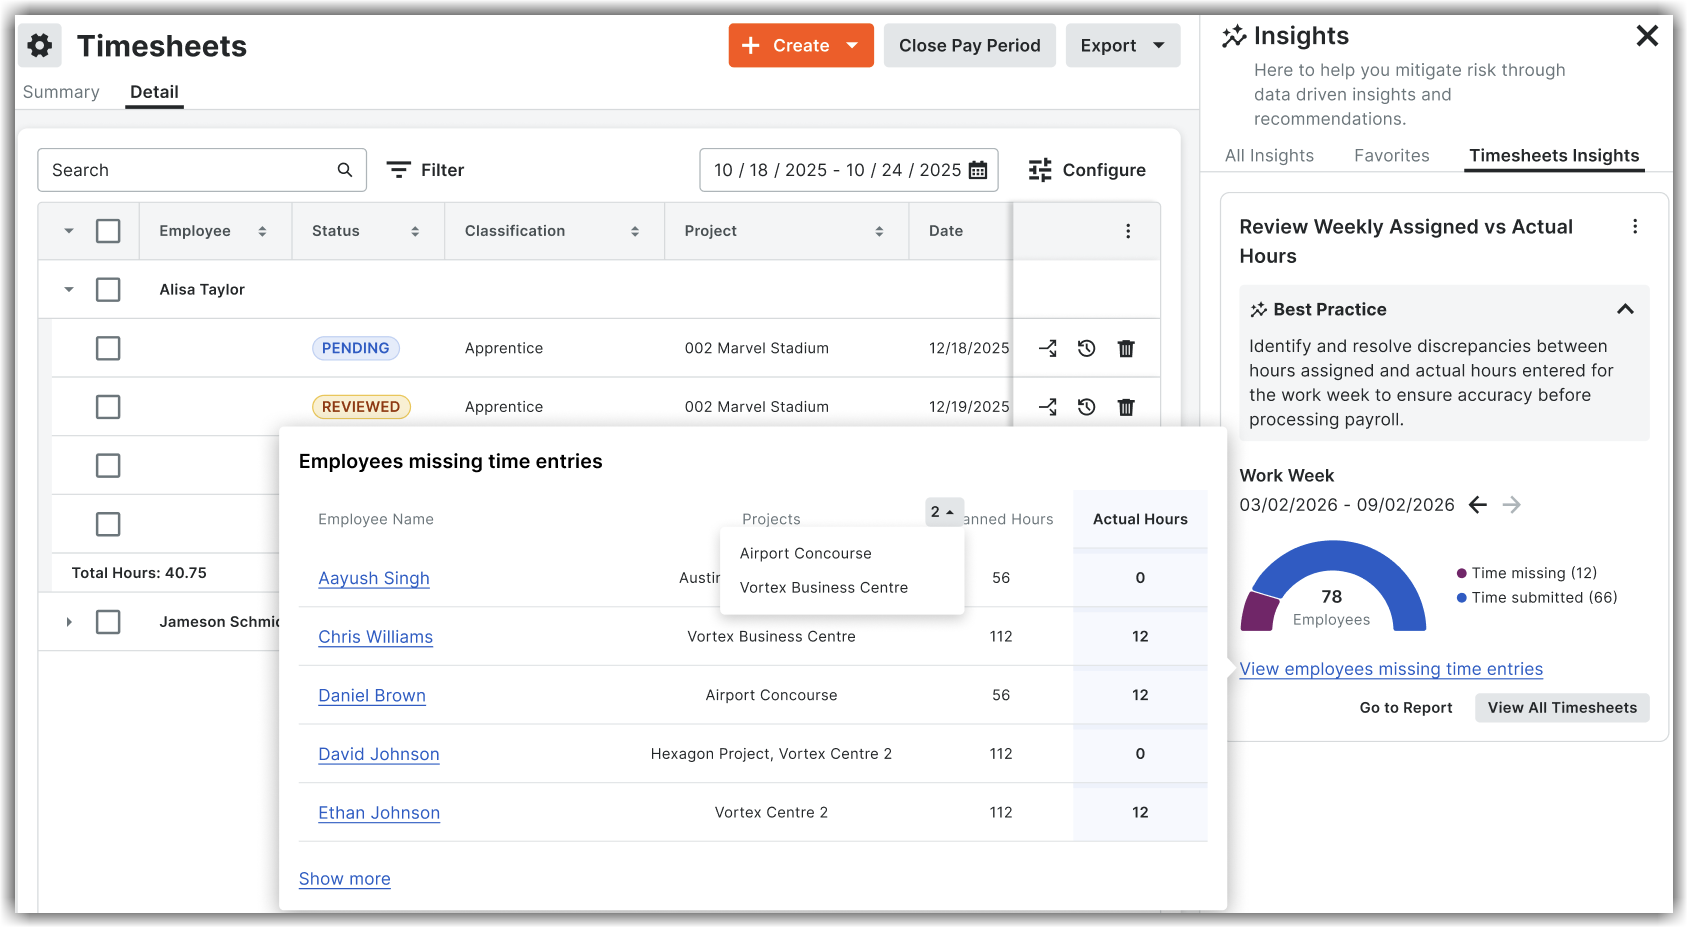
Company-Level Timesheets: Show/Hide Insights Features
Provides visibility into the employee time submission coverage across the entire organization. This insight is available in the company-level Timesheets tool.
Note: To access Timesheets Insights, users require 'View Company Timesheet Insights' granular permission enabled on the Insights tool.
The company-level Timesheets insight:
Compares Weekly Assigned versus Actual Hours across your organization to highlight employees with missing time (Planned > Actual) or excessive hours (Actual > Planned) for an active project. Assigned (planned) hours reflect Resource Planning assignment, while actual hours are derived from timesheets. Payroll administrators and project stakeholders can quickly spot discrepancies between assigned and actual hours for the current or previous work week to ensure accuracy before processing payroll.
Provides a single, company-wide view of submitted and missing time entries. Payroll administrators and project stakeholders no longer need to check projects one by one to find incomplete or inaccurate time entries.
Helps to monitor labor risks early, ensuring accurate, on-time payroll and labor forecasting.
The Review Weekly Assigned vs Actual Hours section in the insight contains the following components:
Work Week: Allows to select the current week or previous week for which you want to view the timesheet data.
Visual gauge: Displays the count of submitted time and missing time entries for the selected week. On hovering over Time submitted or Time missing, the percentage breakdown for the time submitted or missing is shown.
View employees missing time entries: Allows to view a list of employees and their missing time entries in a separate screen in detail. For example, employee name, project name, planned hours, and actual hours. Clicking on Show More shows data for all employees. Users can drill-down to view each employee's data by clicking on their name.
View All Timesheets: Navigates to the company-level Timesheets tool, listing all the employees and their data in detail. Users can filter and view the required employees' data.
Go to Report: Allows to view a pre-populated report template that shows a filtered report of all time entries for the selected work week.
Company User Engagement – Last 6 Weeks: Show/Hide Insights Features
Provides a view of user logins and activity across all your projects for a rolling six-week period. Designed for company-level administrators, executives, and operations leaders using Procore, it helps you quickly identify low engagement among specific users, roles, or projects.
The Company User Engagement - Last 6 Weeks insight allows you to:
Compare active versus inactive users across all projects, including internal staff and external collaborators.
Identify your most and least active projects, including their recent activity levels.
Track specific actions (create, view, update, delete) on platform (Desktop, Mobile, or both) using filters.
Surfaces summary metrics, such as total projects, total users, logged-in users, and internal versus external breakdown.
By using this insight data, company administrators and leaders can target training and change management to where it’s needed most. They can use this insight data in internal Procore adoption or digital health reviews to drive better ROI. It helps to monitor rollout and adoption of Procore and key tools over time.
To view a full user activity report, click Go To Report. To see a complete list of all project users and their activity levels, including the tools they use, click View All Users. 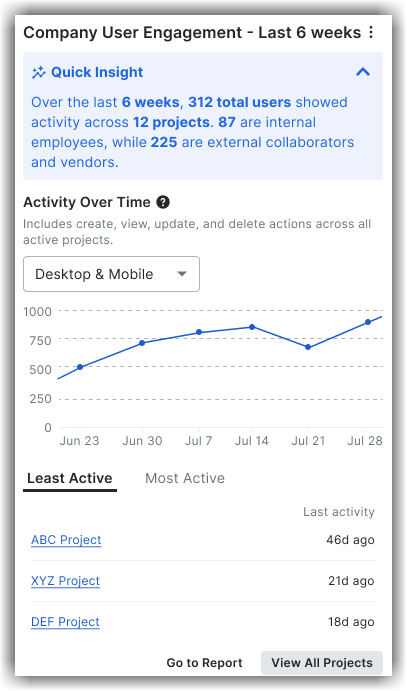
Company's Unfunded Commitment Change Orders (COOs): Show/Hide Insights Features
Provides a visibility into Unfunded Commitment Change Orders (COOs) that have NOT been linked to owner funding (Prime Contract Change Orders(PCCO)). The insight you spot and reduce financial risk from COOs that lack a funding source. It aggregates this risk across the entire organization, providing executives and financial controllers a view of total unfunded exposure across all active projects.
Availability and Access: To maintain data security and for proper product entitlement, the following access logic are applicable:
Available to users with Procore Analytics and Insights (Cost Management) enabled.
Requires the 'View Change Order Insights' granular permission enabled on the Company's Insights tool.
Available to Company Administrators, Insights Administrators, or users with the 'View Change Order Insights' granular permission enabled.
The Company's Unfunded Commitment Change Orders insight:
Shows a visual aging breakdown (0–30, 31–60, and 60+ days) and a granular table highlighting the highest-value outstanding CCOs and the missing PCCO.
Aggregate unfunded exposure across all active projects and show it as a % of total contract value.
Allows you to track aging and See exactly how long unfunded orders have been outstanding.
Bridges the gap by automatically linking commitments to prime contracts.
Allows you to drill into individual unfunded CCOs to see amounts, aging, and creation dates. Use the Highest Percentage Unfunded CCOs section to prioritize follow‑up.
Provides a view of all projects with unfunded CCOs, including their impact on each project. Click View all projects with unfunded CCOs to view additional information of all projects.
Helps to prevent unreimbursed work and revenue leakage when CCOs aren’t backed by owner funding.
Gives both project teams and executives the visibility needed to protect margins and ensure subcontractors are paid.
To navigate to a more detailed report, click Go to Report, or go directly to the Commitments tool to link CCOs to PCCO and clean up exposure. 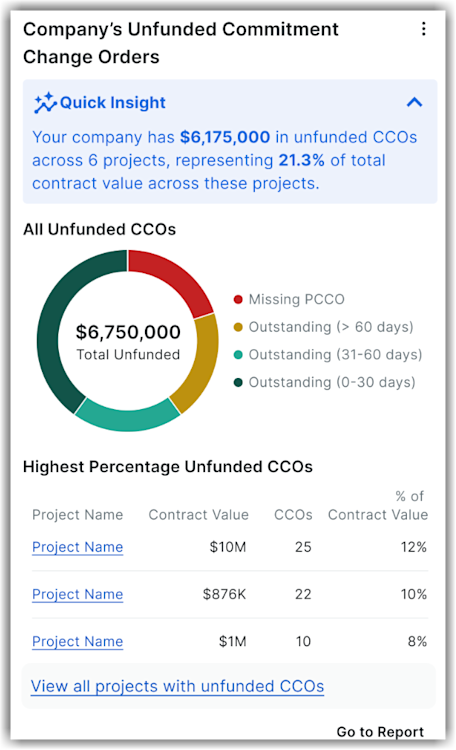
Company Inspection Item Pass Rate - Last 6 Months: Show/Hide Insights Features
Shows the percentage of inspection items that pass on the first inspection for a rolling last six months period. This insight helps you track and improve inspection quality and safety across projects.
A high first-time pass rate means fewer delays, lower costs, and less rework. By comparing performance with industry standards, you can quickly spot patterns, address recurring problems, and improve project quality—saving time, reducing rework, and keeping your projects on track.
Note: To access the company-level Inspection Item Pass Rate insight, users require 'View Company Inspection Insights' granular permission enabled on the company-level Inspection tool.
The company-level Inspection Item Pass Rate insight:
Shows the average percentage of inspection item pass rate on the first inspection across projects for the company with industry as a benchmark. By comparing performance with industry standards, teams can identify areas for improvement and adopt best practices, ultimately improving project quality and reducing inspection delays.
Displays a snapshot with Quality or Safety in the insight's heading section based on your quality or safety tool breakdown. For example, Quality: Company Inspection Item Pass Rate - Last 6 Months or Safety: Company Inspection Item Pass Rate - Last 6 Months.
Provides a rolling last six months view to highlight trends in Conforming versus Deficient items across projects.
Allows to hover over the line charts to see detailed monthly statistics (total line items, conforming, deficient, N/A). For example, number of inspections items not responded to or unresponsive.
Highlights the effectiveness of inspection processes by revealing how often inspections meet requirements on the first attempt.
Allows to drill into projects with deficient inspections. Click View projects with the highest count of deficient inspections to identify projects or templates that frequently fail so you can target training or process changes.
To navigate directly to reports, click Go to Reports, or go directly to the company-level Inspections tool for deeper analysis and follow‑up. 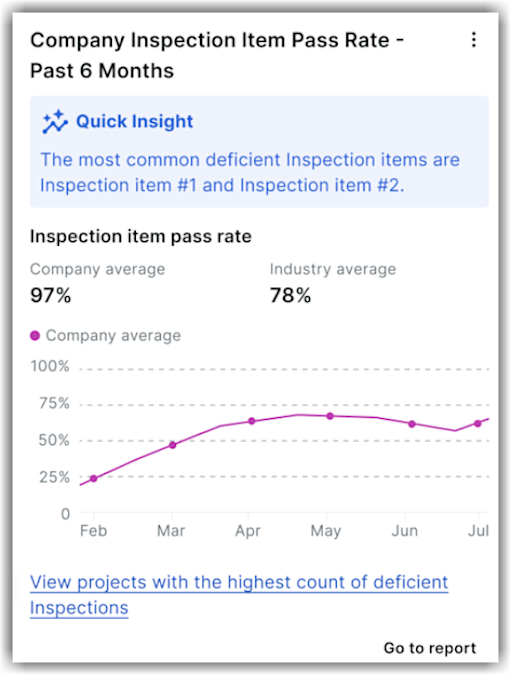
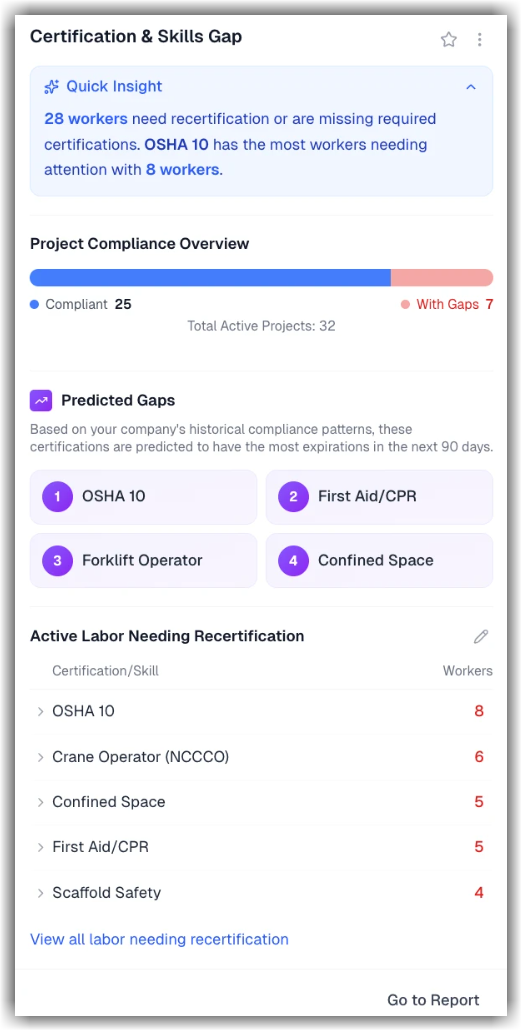
Company Certification & Skills Gap: Show/Hide Insights Features
Shows a clear, real-time view of workforce certification gaps, helping users proactively manage compliance, reduce safety risk, and avoid project delays. This new company-level insight highlights the number of projects that are compliant, total number of active projects, and the predicted gaps.
The Certification & Skills Gap Insights tool compares required certifications (for example, OSHA 10, NCCCO) against assigned workers to surface missing or expired certifications and skill gaps across your projects and workforce. Gaps are visible at both portfolio and project levels so teams can quickly understand:
Which certifications are missing,
Where gaps are concentrated , and
Which projects are most at risk.
This insight helps prevent last-minute scrambles, safety risks, and potential compliance violations. The Insight displays all active certifications and skills, as well as the number of workers requiring recertification—including those with expired or expiring certifications. To view all outstanding certifications and skills by user type, click View all labor needing recertification. You can use the![]() icon to edit the relevant certifications details that you want to be displayed in the insight.
icon to edit the relevant certifications details that you want to be displayed in the insight.