company details
procore insights availability
Project and Company Insights are available in US, CA, UKI, ANZ, and MENA regions for customers on eligible plans with Insights or with purchase of Procore Analytics.Key Features of Company Insights Include:
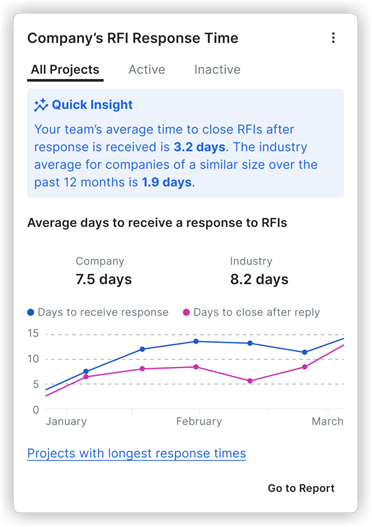
Company RFI Response Time
Tracks how long it takes for RFIs to be responded to across all projects. Key metrics include company-wide RFI response time, industry benchmark comparisons, and projects with the longest response times. Users can filter by All Projects, Active, or Inactive projects. The Quick Insight area lets you see the performance of your company against the industry's average response time.
Company RFI Trends
Provides visibility into the quantity and types of RFIs across your project portfolio over the past 12 months. Includes the following key metrics:
- Quick Insight: Displays the two most common RFI topics across your projects in the past 12 months.
- Chart View: Visualizes RFI counts, broken down into project completion stages (25% increments). Hover over each stage to view the following:
- Completed Stage (25%): Shows the actual two most common RFI topics for the project.
- Current Stage (25%): Displays both actual and industry-wide common RFI topics for similar project types.
- Upcoming Stages (25% each): Reveals the most common RFI topics across the industry for similar project types
- Most Common RFI Topics: Provides a link to your most common RFI topics by project type (sector). Click Show More to see all RFI topics and their associated metrics for deeper insights.

Company Submittal Response Time
Measures how long it takes to respond to submittals across all projects. Key metrics include company-wide submittal response time, industry benchmarks, and projects with the longest response times. Users can filter by All Projects, Active, or Inactive projects. The Quick Insight area lets you see the performance of your company against the industry's average response time.

Company Daily Log Completions
Tracks the consistency of Daily Log completion across active projects. Key metrics include average days to complete Daily Logs company-wide, industry benchmarks, and Daily Log completion trends over time. The Quick Insight area lets you see the performance of your company against the industry's average response time.

Company Pending and At Risk Submittals
Highlights submittals that are at risk of causing project delays. Key metrics include a breakdown of pending submittals across all active projects, submittal due date status (On Track, At Risk, Overdue), and industry comparisons.
'This Project's Submittals by Stage' enables users to understand where each submittal currently stands in its lifecycle and helps identify any potential bottlenecks. This section includes five stages:
- Draft - Submittals that have not yet begun the review workflow.
- Pending Submission - Submittals that have entered the review workflow and are awaiting action from the 'Submitter.'
- External Review - Submittals under review by an external approver, such as an architect or engineer.
- Internal Review - Submittals under review by an internal team member, such as a project manager.
- Closed - Submittals that have completed the entire workflow and are marked as 'Closed.'
'Number of Submittals by Due Date' categorizes submittals based on their due date status, allowing yours to manage time-sensitive tasks effectively. Section details include the following:
- On track - 'The Last Step Due Date' is on or before the 'Final Due Date', indicating the submittal is progressing as planned.
- Paused - The submittal was rejected by an approver and requires attention from the submittal manager to proceed.
- Overdue -The submittal has exceeded its final due date and remains unclosed.
From this insight, you can view a pre-populated report template that shows details on current submittals, their stages, and the responsible party. You can also go directly to the submittals tool within Procore to take action on pending items or make updates to move submittals to the next stage.

Company Spend on General Conditions
This insight provides a real-time view of a specific project's spending on general conditions against its allocated budget.
- Quick Insight: Provides critical benchmark information such as, "General Conditions account for approximately 6.5% of the total budget."
- General Conditions Budget: Displays the Budget, Spent, and Remaining core financial figures.
- Burn Rate Chart: Visually represents the project's spending trend over time, showing Project spend, Forecasted spend, and Past performance benchmarks. Hovering over the chart displays detailed metrics for specific periods.
- Actions:
- Review Spend: Directs you to a tear sheet with a detailed breakdown of spending.
- Review Budget: Links to the project's budget tool.

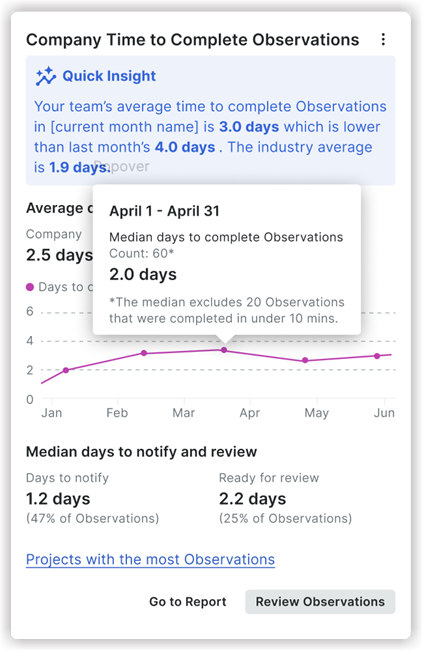
Company Time to Complete Observations
The Company Time to Complete Observations insight shows your team's average time to close an Observation item. This helps you identify potential bottlenecks in the observation resolution process and see how your team's performance compares to the industry average.
- Quick Insight: This section highlights your team's average time to complete Observations for the current month, and compares it to the previous month and the industry average.
- Average days to complete Observations: This section shows your company's average time to close an Observation and compares it to the industry average, with a line graph showing the trend over the last six months.
- Median days to notify and review: This section breaks down the average time it takes for Observations to be notified and the average time they spend in the "Ready for review" status.
- Projects with the most Observations: A table that lists the projects with the highest volume of closed Observations, showing metrics such as the number closed in under 10 minutes, days open to close, and time spent in review.
From this insight, you can navigate to a more detailed report by clicking Go to Report, or go directly to the Observations tool by clicking Review Observations.
Company Equipment Utilization - Last 7 Days
The Idle Equipment insight shows you which of your company's equipment has been sitting idle for the past 7 days. Equipment is considered idle if it has had no engine activity, movement, or mention in Daily Logs, Timesheets, or Inspections across active projects. This insight helps you see which equipment is being underutilized so you can make better decisions about your resource allocation and budget.
- Quick Insight: This section provides a summary of the total number of idle equipment over the past 7 days.
- Idle vs. Utilized Gauge: A visual representation of the percentage of idle versus utilized equipment across your company.
- Idle Equipment List: A table that lists each piece of idle equipment and includes the following information:
- Equipment ID
- Onsite Project
- Last Activity
- Last Activity Date
Recommended Actions:
- Review projects with idle equipment: Investigate why the equipment is not being used.
- Assign equipment to other projects: Move idle equipment to projects where it is needed.
 |
 |
Company Days without an Incident
The Company Days Without an Incident insight helps you track and promote safety by displaying the consecutive number of days your company has gone without an incident. It helps you monitor your company's safety performance in real-time and recognize teams for maintaining a safe working environment.
- Best Practice: This section provides a recommendation to recognize crews for hitting safety streak milestones (e.g., 30, 60, or 90 days) to reinforce safe behaviors.
- Days since last recordable incident: Shows the total number of days since the last major, recordable incident was logged. This metric tracks your current streak.
- Monthly milestone: A progress bar that tracks the number of incident-free days within the current month.
- Days since last any incident: Displays the number of days since any type of incident (including minor ones) was logged.
- Projects with the most incidents: This table (not shown on the main card) displays a list of active projects that have the highest count of incidents, allowing you to identify which projects may need additional safety focus.
