Project Management Report
Table of Contents
- Overview
- Project Insights
- Project Scorecard
- Key Influencers
- Root Cause Analysis
- Project Health Chart
- Project Status Report
- Project Tool Utilization
- Project Trending
- Ball In Court
- Projects
- Project Dates
- Project Vendor
- Project Vendor Insurance
- Project Vendor Insurance Compliance
- Project Role Matrix
- Project Resource Plan
- Schedule Task Insights
- Schedule Task Status
- Schedule Task Gantt
- Schedule Tasks
- Schedule ToDo Gantt
- Schedule ToDos
- Meetings
- Drawing Revisions
- Photos
- RFI Insights
- RFIs
- Submittal Insights
- Submittals
- Submittal Approvers
- Correspondence Insights
- Correspondences
Overview
Project Insights
Summary
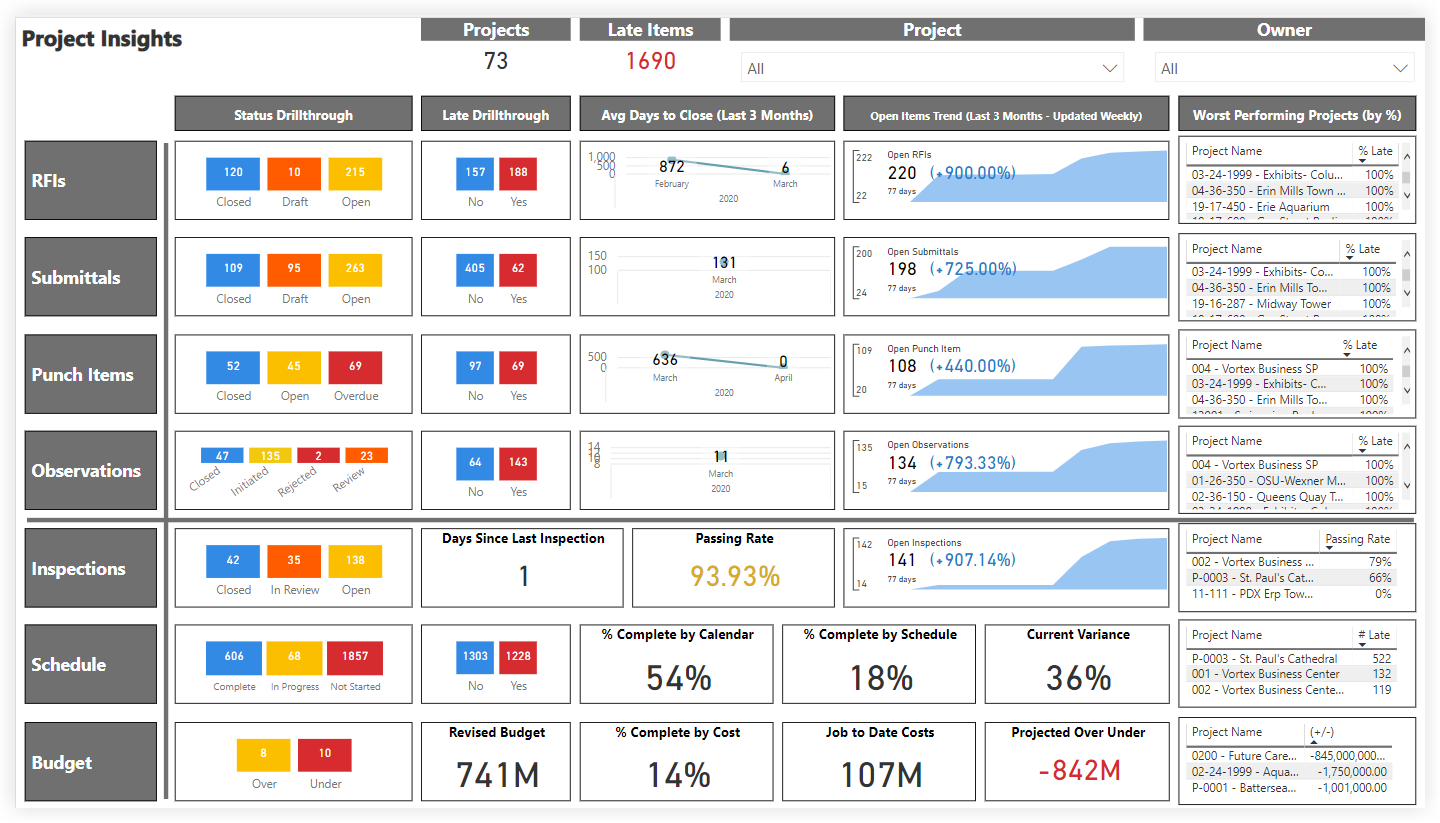
As part of the Analytics Project Management Report, the Project Insights report page provides a high level view of one or more projects. This report page supports drill-through actions that allow you to navigate directly to more detailed report pages for the included Procore tools.
Sample Report Page
This sample report page was created using mock data for demonstration purposes only.
Project Scorecard
Summary
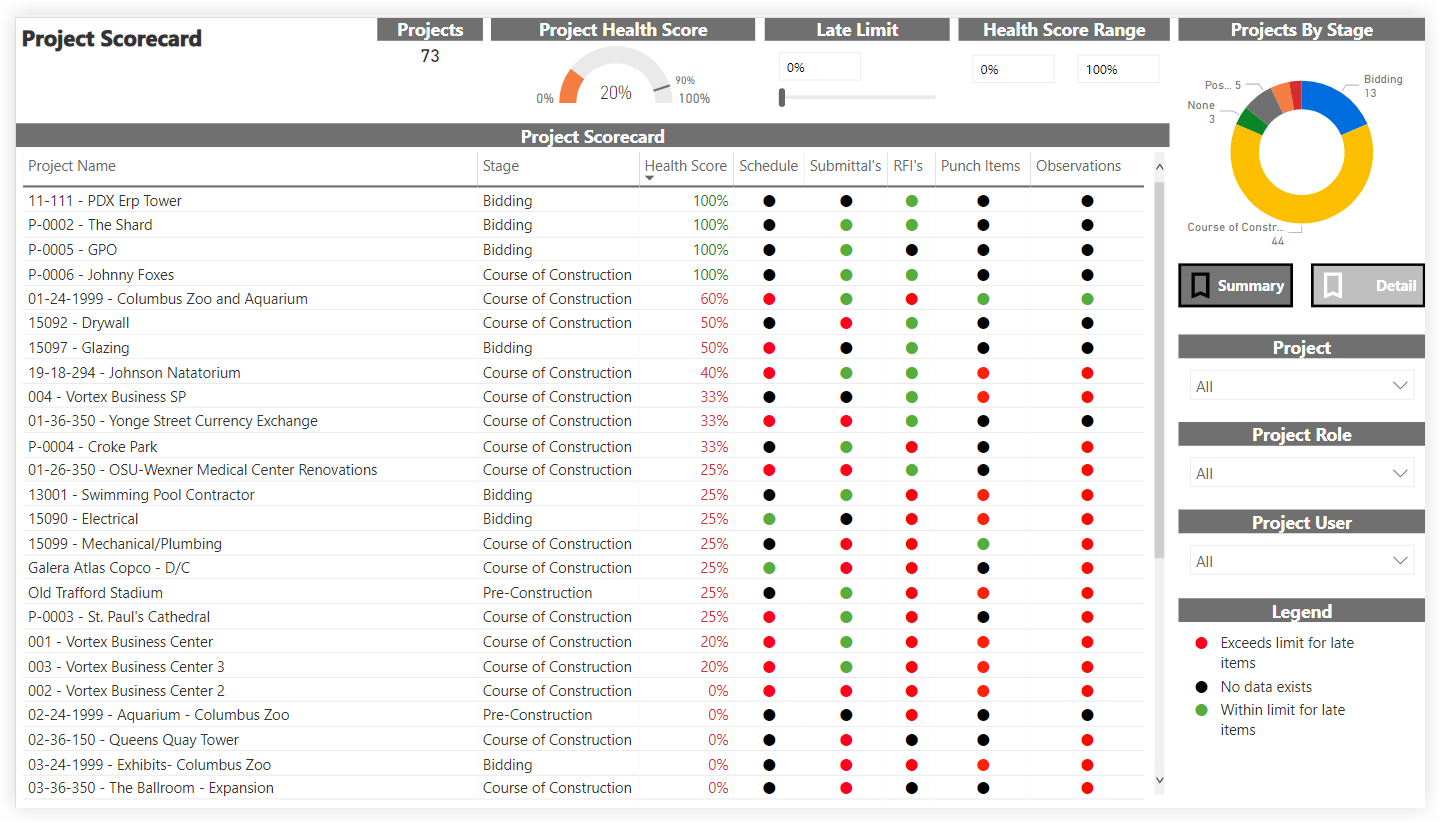
As part of the Analytics Project Management Report, the Project Scorecard report page was designed to quickly identify and quantify late items in proportion to total items using certain metrics. The 'Late Limit' slicer controls the percentage of late items allowed for the included Procore tools in order to receive a green dot or a red dot. Each project's 'Health Score' is calculated using the 'Late Limit' slicer and the number of green dots. The 'Detail' bookmark changes the view of this report page from dots to percentages and the 'Summary' bookmark changes the view from percentages to dots.
Sample Report Page
This sample report page was created using mock data for demonstration purposes only.
Key Influencers
Summary
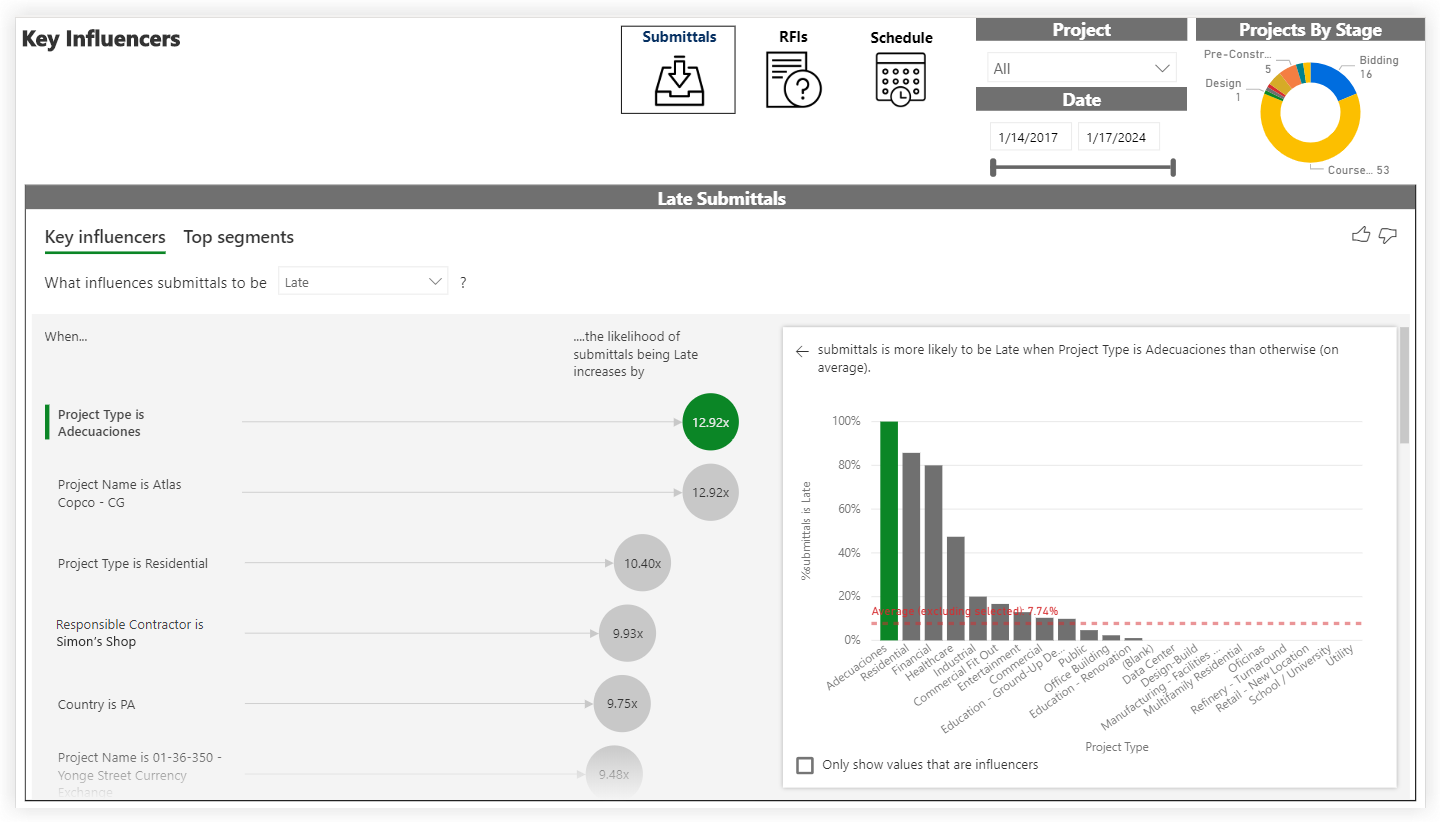
The Key Influencers page is part of the Analytics Project Management Report. This page analyzes data from various Procore tools to show the likelihood of a specific item (Submittals, RFIs, or Schedule) to end up being late on a project. Using the Project and Date controls, you can include all available data or narrow the report to look at a specific project or date range.
- The Projects By Stage donut chart shows the number of projects included the report's scope by stage of construction.
- The main area of the Key Influencers report (for example, the 'Late Submittals' area shown below) includes these tabs: Key Influencers and Top Segments.
- The Key Influencers tab lets you select a metric to investigate from the drop-down list. The selected value is Late.
- The visual on the left contains a visual that summarizes the factors that contribute to the likelihood of an item being late, along with a calculated estimate (for example, in the illustration below, a submittal on a Residential project is 10.40x more likely to be late than a Public project.
- The bar chart on the right displays all of the values contributing to the result showing on the Key Influencers tab for the selected item. It also shows the threshold at which potential values are shown on the Key Influencers chart.
Sample Report Page
This sample report page was created using mock data for demonstration purposes only.
Root Cause Analysis
Summary
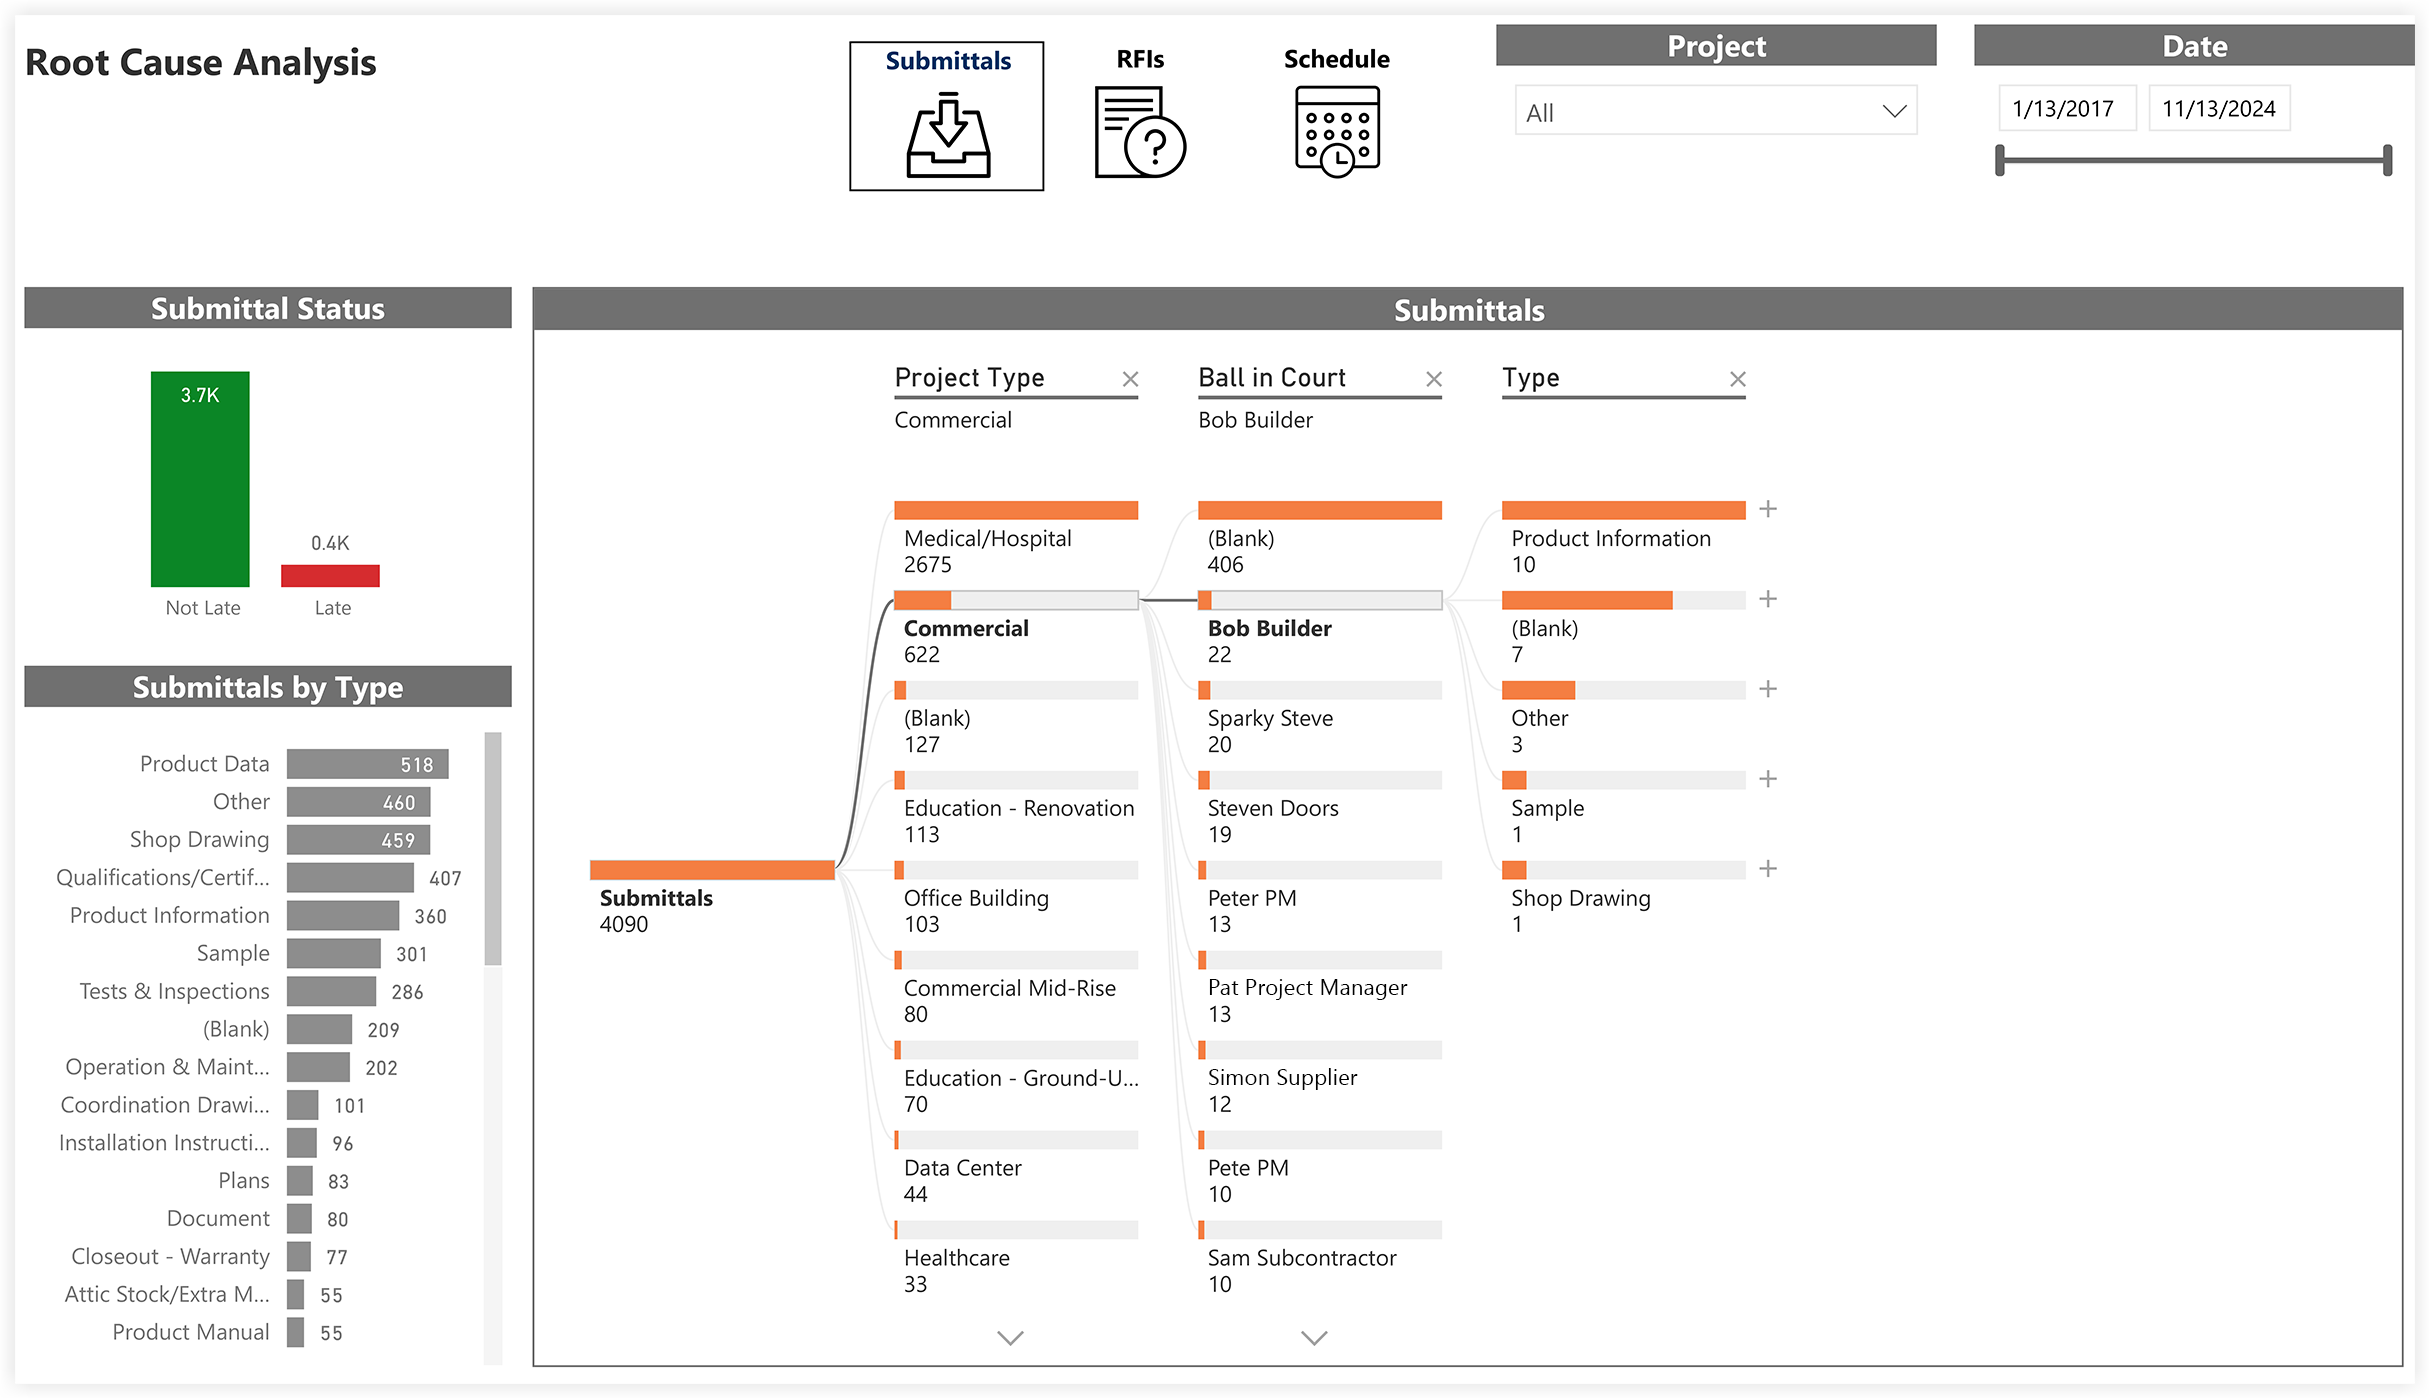
The Root Cause Analysis page is part of the Analytics Project Management report. With this page, you can analyze the item data (for example, Submittals, RFIs, and Schedule) in your company's account by various dimensions. Using the Project and Date controls, you can include all available data or narrow the report to look at a specific project or date range. This report contains these visuals:
- The bar chart on the left shows the total number of items in a bar chart format with a numeric count showing the total number of items in each category.
- The horizontal bar chart on the lower left aggregates items by the available types. In the example below, submittals are categorized by any default and/or custom submittal type. See What are the default submittal types in Procore? and Create Custom Submittal Types.
- The decomposition tree on the right uses Power BI's Artifical Intelligence (AI) to visualize your Procore data and its components so you can quickly perform an ad-hoc analysis by exploring your data across multiple dimensions.
Tip
What can I do with a decomposition tree? To learn more, see this documentation resource on the Microsoft's Power BI site.Sample Report Page
This sample report page was created using mock data for demonstration purposes only.
Project Health Chart
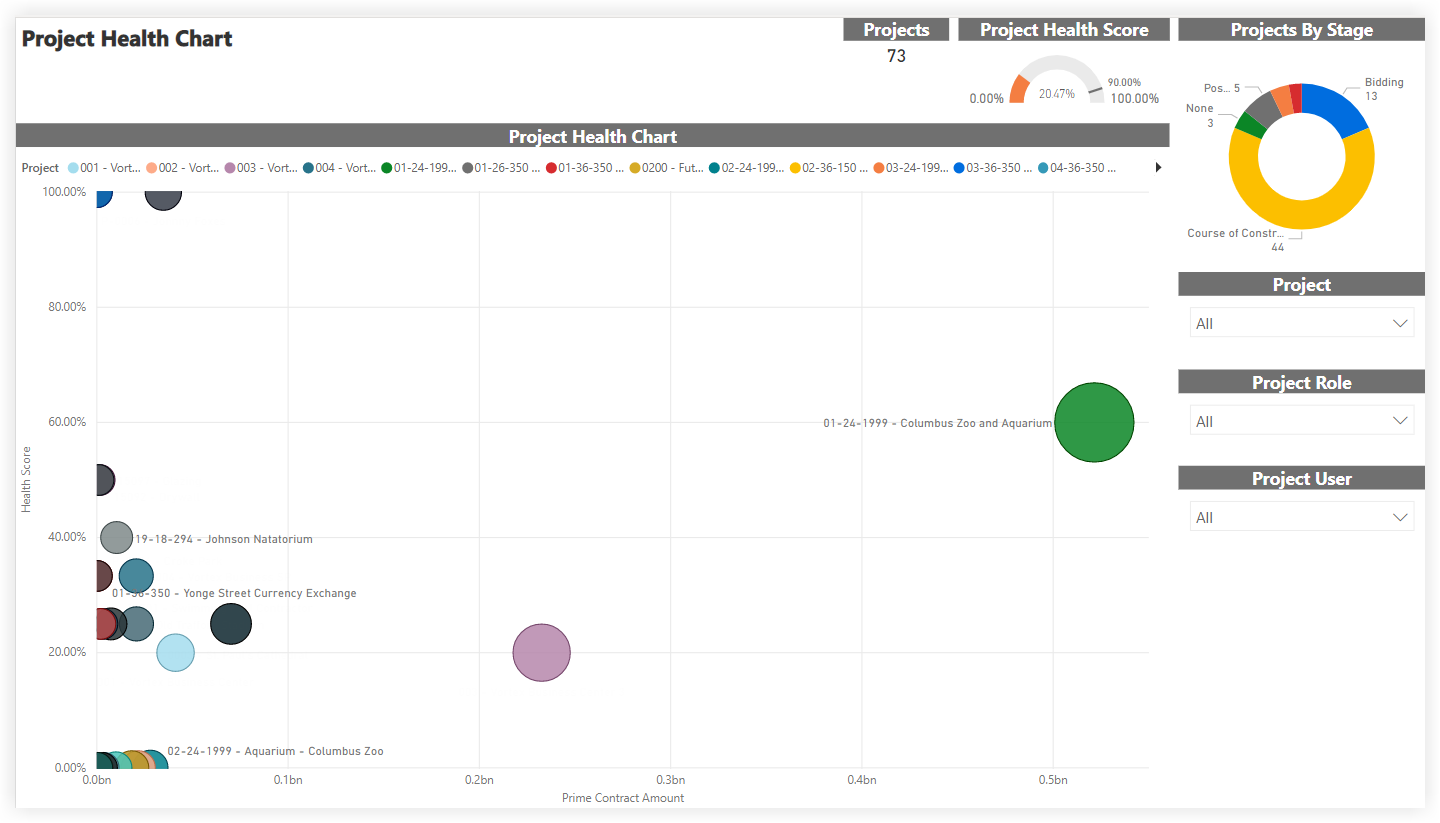
Summary
The Project Health Chart is part of the Analytics Project Management Report. This page looks at the number of Projects listed and shows your company's overall Project Health Score. By applying the Project, Project Role, and Project User filters, you can include all available data or narrow the data plotted in the Project Health Chart to better visualize the relationships and variables between the data points on your Project Scorecard.
Sample Report Page
This sample report page was created using mock data for demonstration purposes only.
Project Status Report
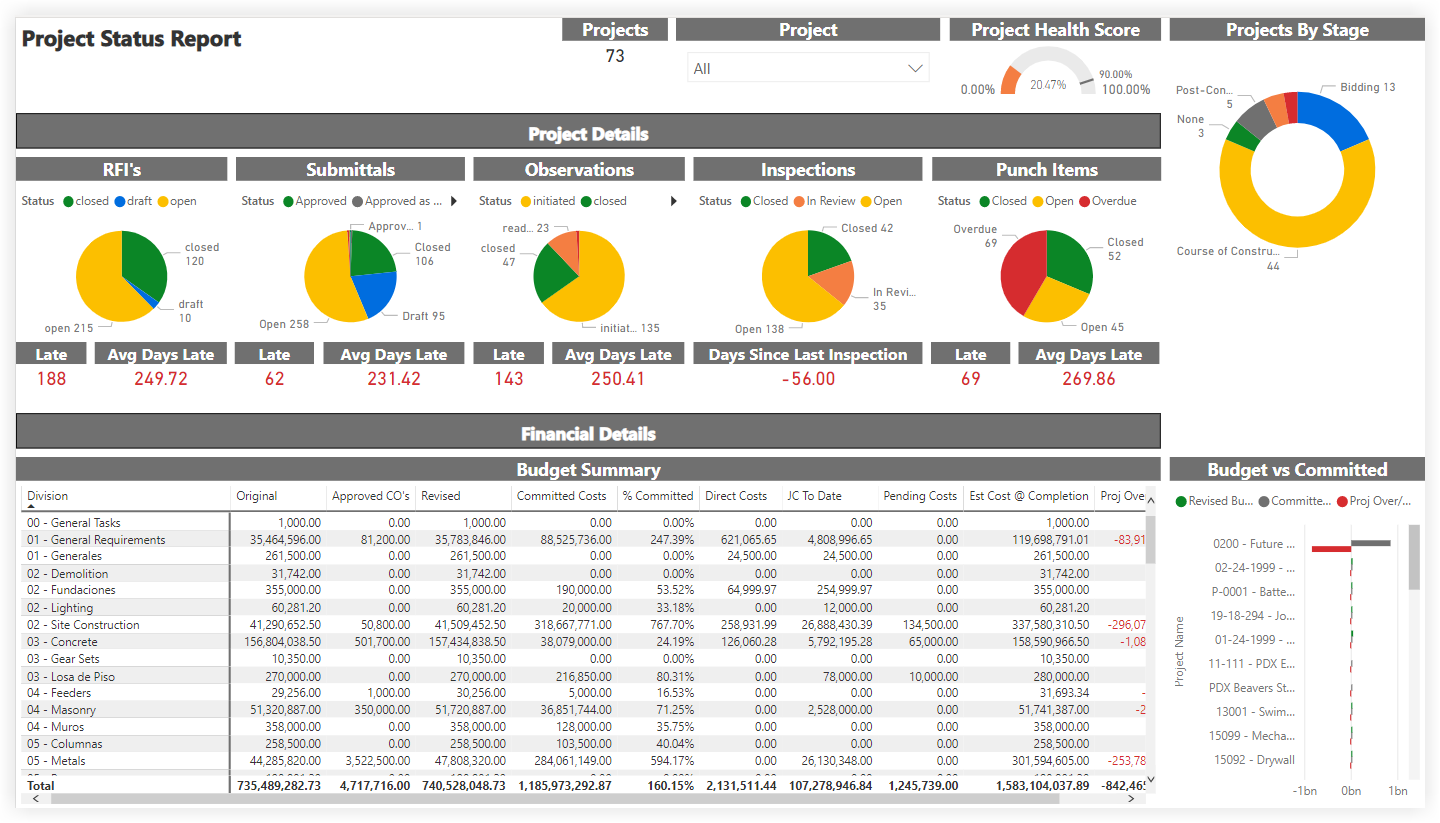
Summary
The Project Status Report is part of the Analytics Project Management Report. The scope for the data is set by the selection in the Project drop-down list. Your Procore user account must be added to the appropriate Project level Directory in order to see a project's data reflected in this page. By applying the Project filter, you can expand the scope for an overview of all proejcts or narrow the data in view to a specific project. It also shows your company's overall Project Health Score and a donut chart summary of your company's Projects By Stage, with a count of the project(s) in each stage of construction.
- The Project Details area shows item status across your company's projects in a pie chart format. For each item, it also shows a count of the late items and summarizes the average number of days for those late items.
- The Financial Details area includes a Budget Summary table that shows budget amounts for the selected project(s) and lists totals by 'Division.' For Procore companies using WBS, see Where is the 'Division' in the cost code segment in Procore's WBS?
- The Budget vs. Committed area plots the budgeted values and committed values on your projects using a two-sided bar graph for easy reading.
Sample Report Page
This sample report page was created using mock data for demonstration purposes only.
Project Tool Utilization
Summary
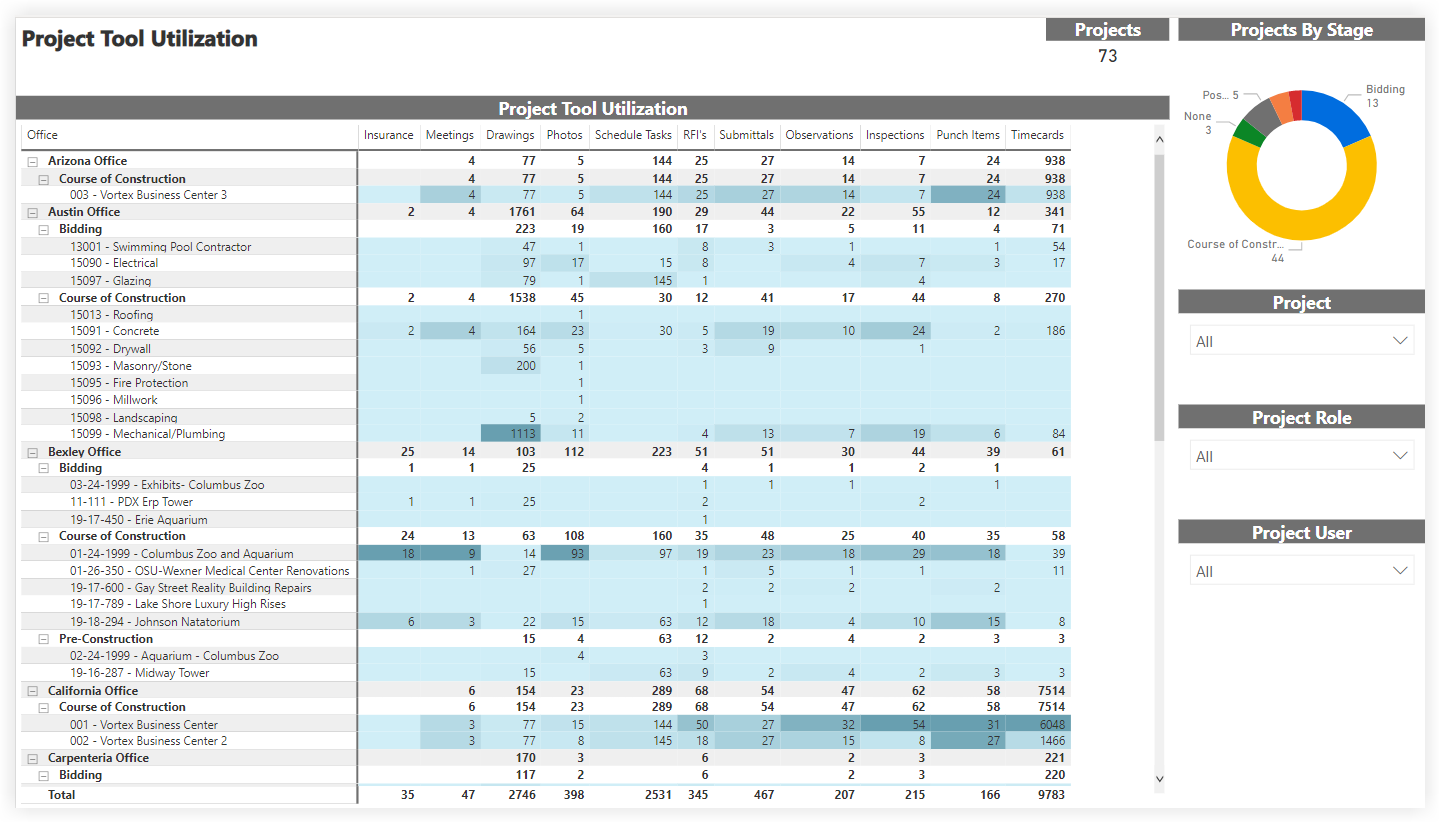
The Project Tool Utilization page is part of the Analytics Project Management Report. It also includes a summary of your company's Projects By Stage, with a count of the project(s) in each stage of construction. By applying the Project, Project Role, and Project User filters, you can include all available data or narrow the data plotted.
- The Project Tool Utilization table groups your WBS cost code segment data (see Where is the 'Division' in the 'Cost Code' segment in Procore's WBS?) by office location. See Add an Office Location and Assign an Office Location to a Project.
- The columns in the columns in the Project Tool Utilization table columns provide counts and a color-coded heat map to shows the number of items created.
Sample Report Page
This sample report page was created using mock data for demonstration purposes only.
Project Trending
Summary
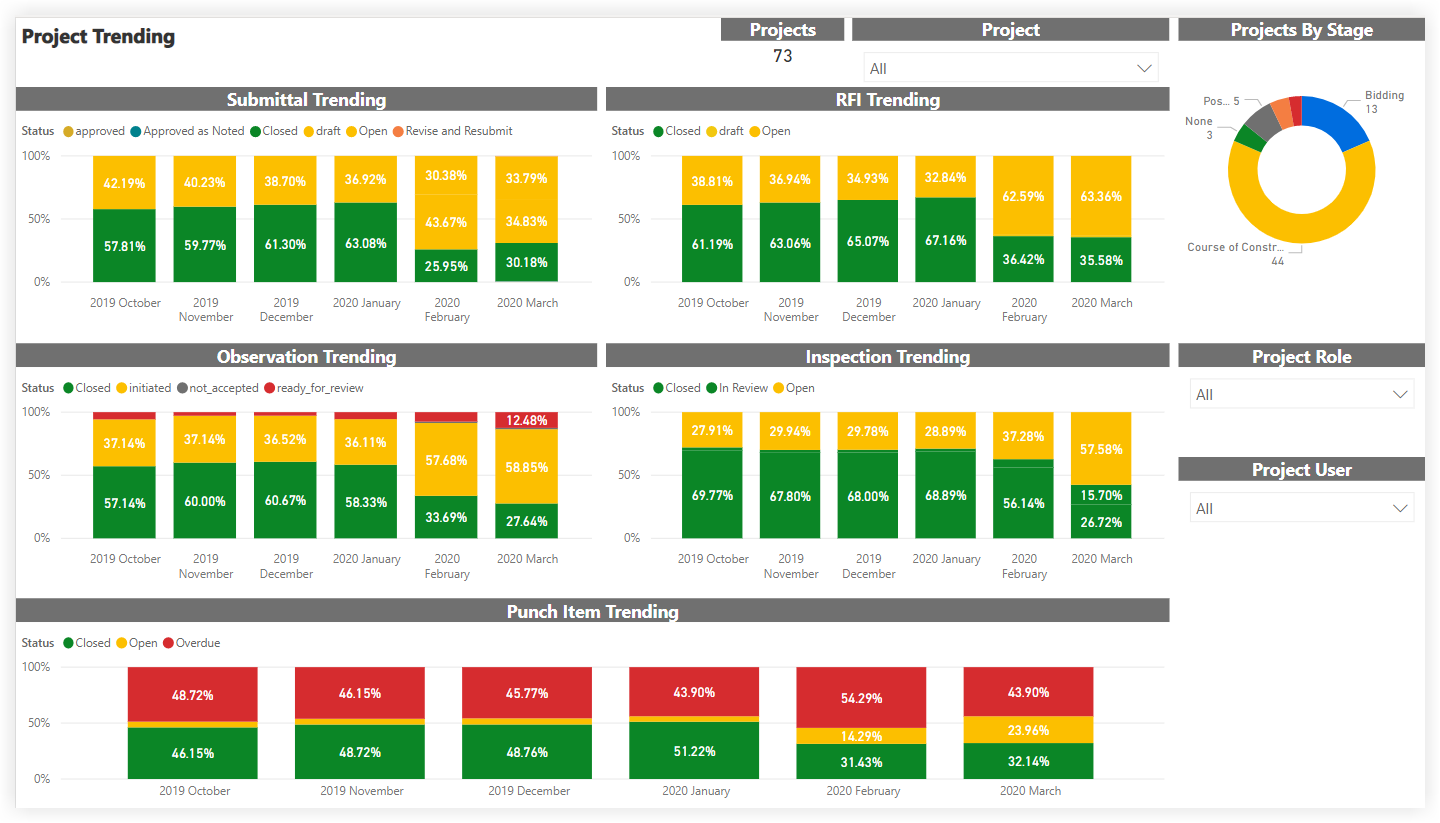
The Project Trending page is part of the Analytics Project Management Report. The scope for the data is set by the selection in the Project drop-down list. Your Procore user account must be added to the appropriate Project level Directory in order to see a project's data reflected in this page. By applying the Project filter, you can expand the scope for an overview of all projects or narrow the data in view to a specific project. It also shows a donut chart summary of your company's Projects By Stage, with a count of the project(s) in each stage of construction.
- The trending areas shows bar charts for trending Procore items. These charts provide percentage summaries of your company's submittals, RFIs, observations, inspections, and punch list items for the past six (6) months.
- Each item's stacked bar chart is color-coded by status for easier reading. Data for this page is derived from weekly snapshots of Procore's item counts.
Sample Report Page
This sample report page was created using mock data for demonstration purposes only.
Ball In Court
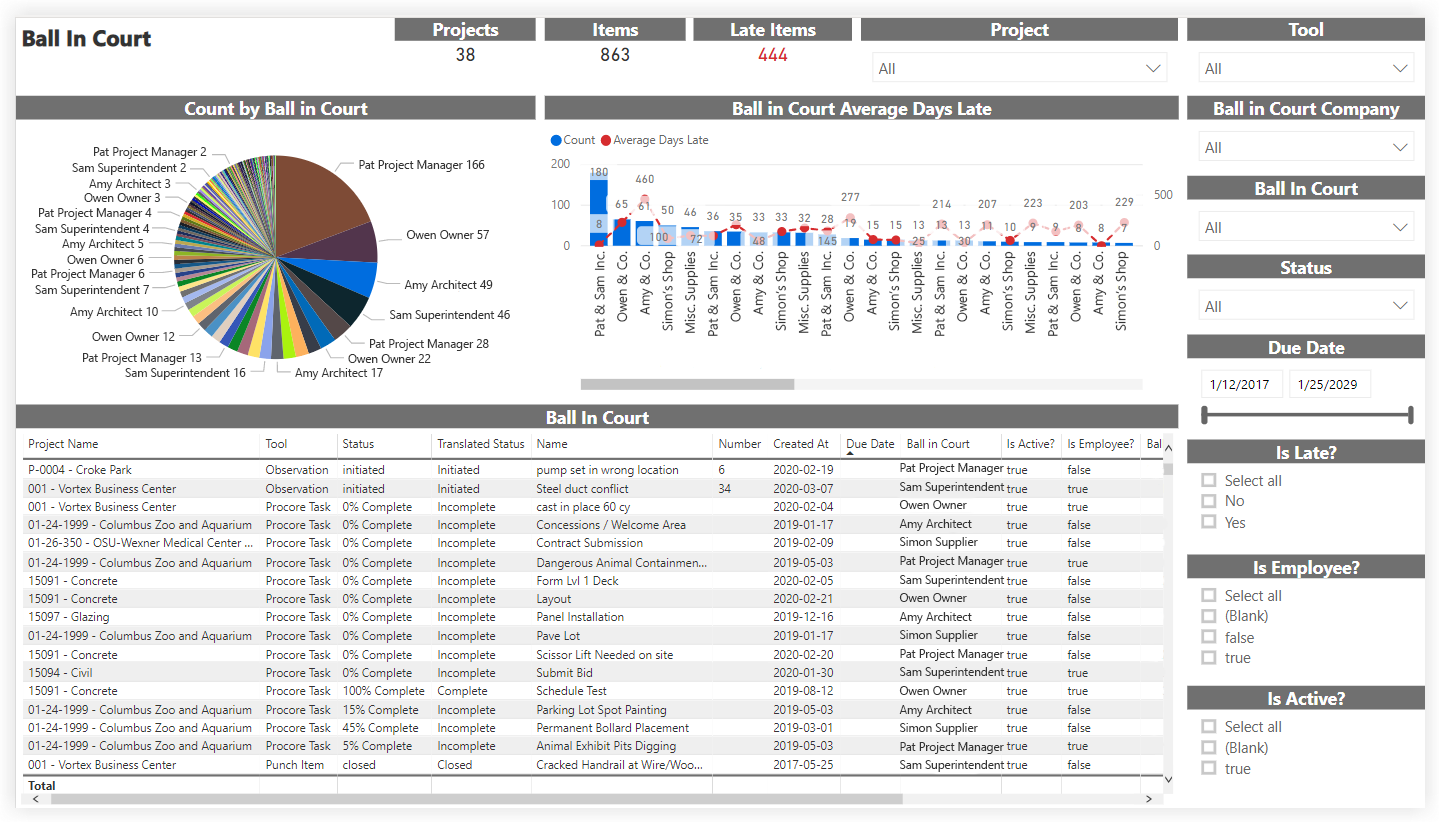
Summary
As part of the Analytics Project Management Report, the Ball In Court report page shows information related to the ball-in-court for items in various Procore Project level tools.
Sample Report Page
This sample report page was created using mock data for demonstration purposes only.
Projects
Summary
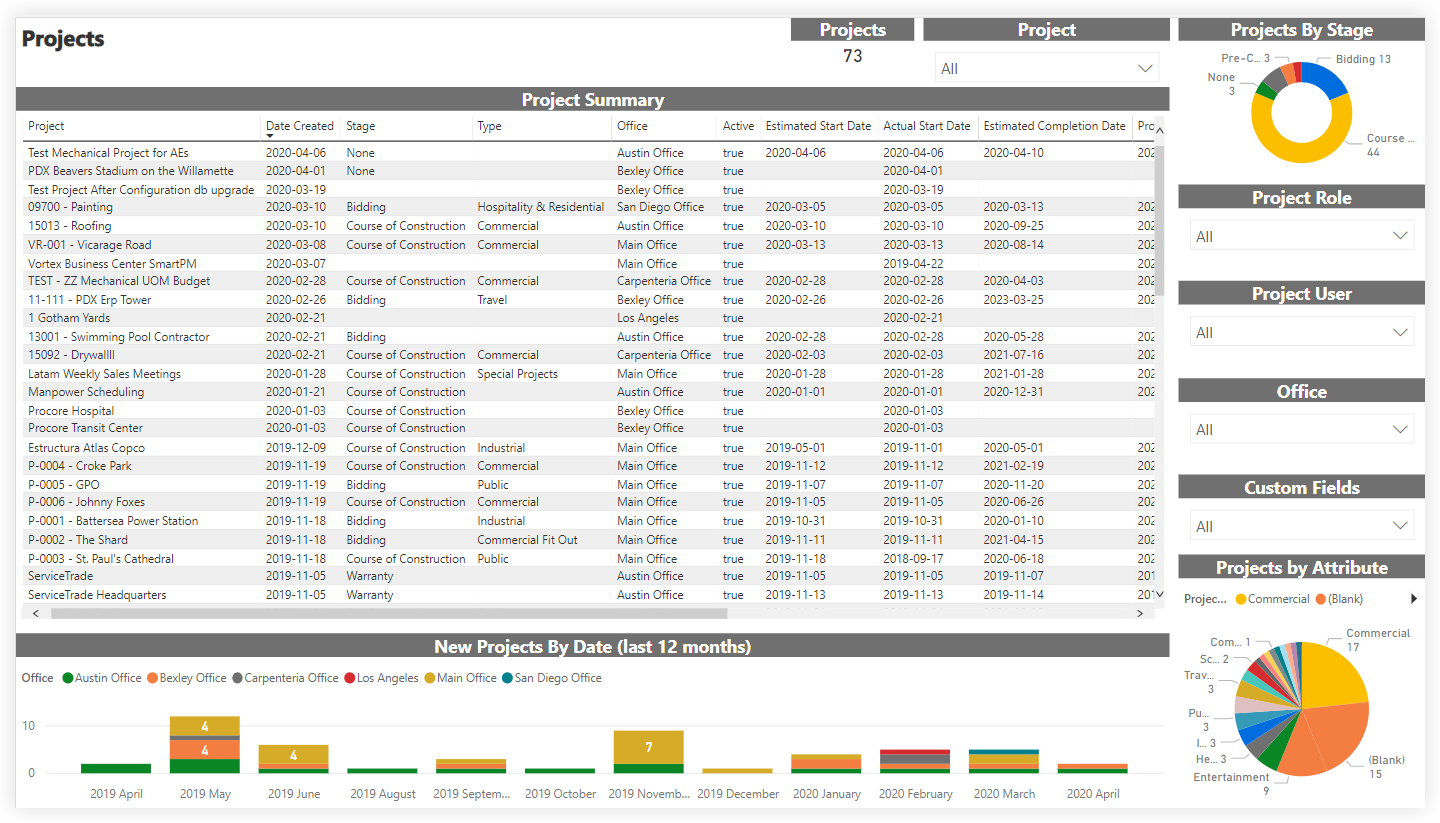
As part of the Analytics Project Management Report, the Projects report page outlines basic information about each project including each project's type, address, start date, and completion date.
Sample Report Page
This sample report page was created using mock data for demonstration purposes only.
Project Dates
Summary
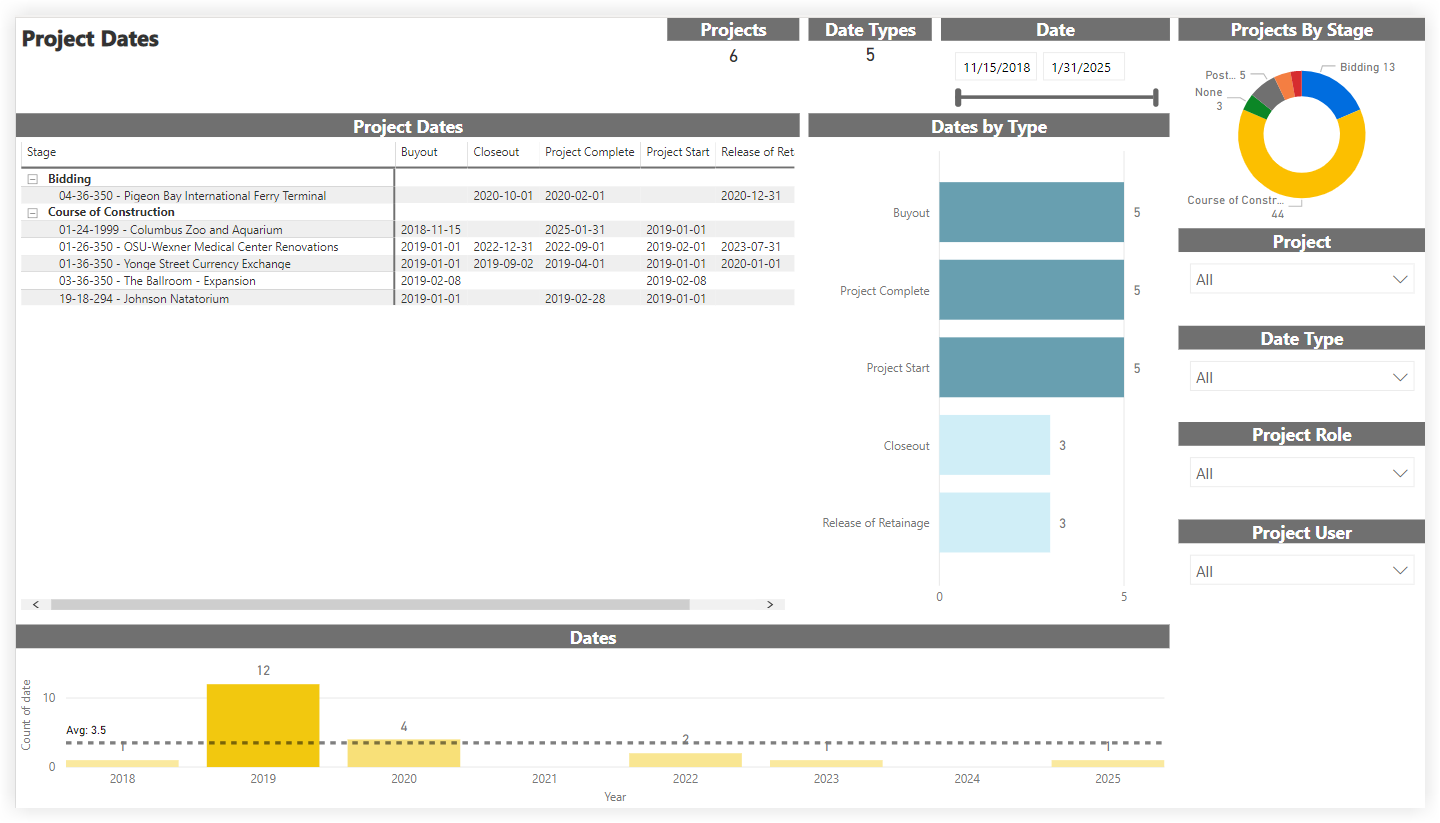
As part of the Analytics Project Management Report, the Project Dates report page includes each project's buyout date, closeout date, completed date, start date, and release of retainage date as entered in Procore.
Sample Report Page
This sample report page was created using mock data for demonstration purposes only.
Project Vendor
Summary
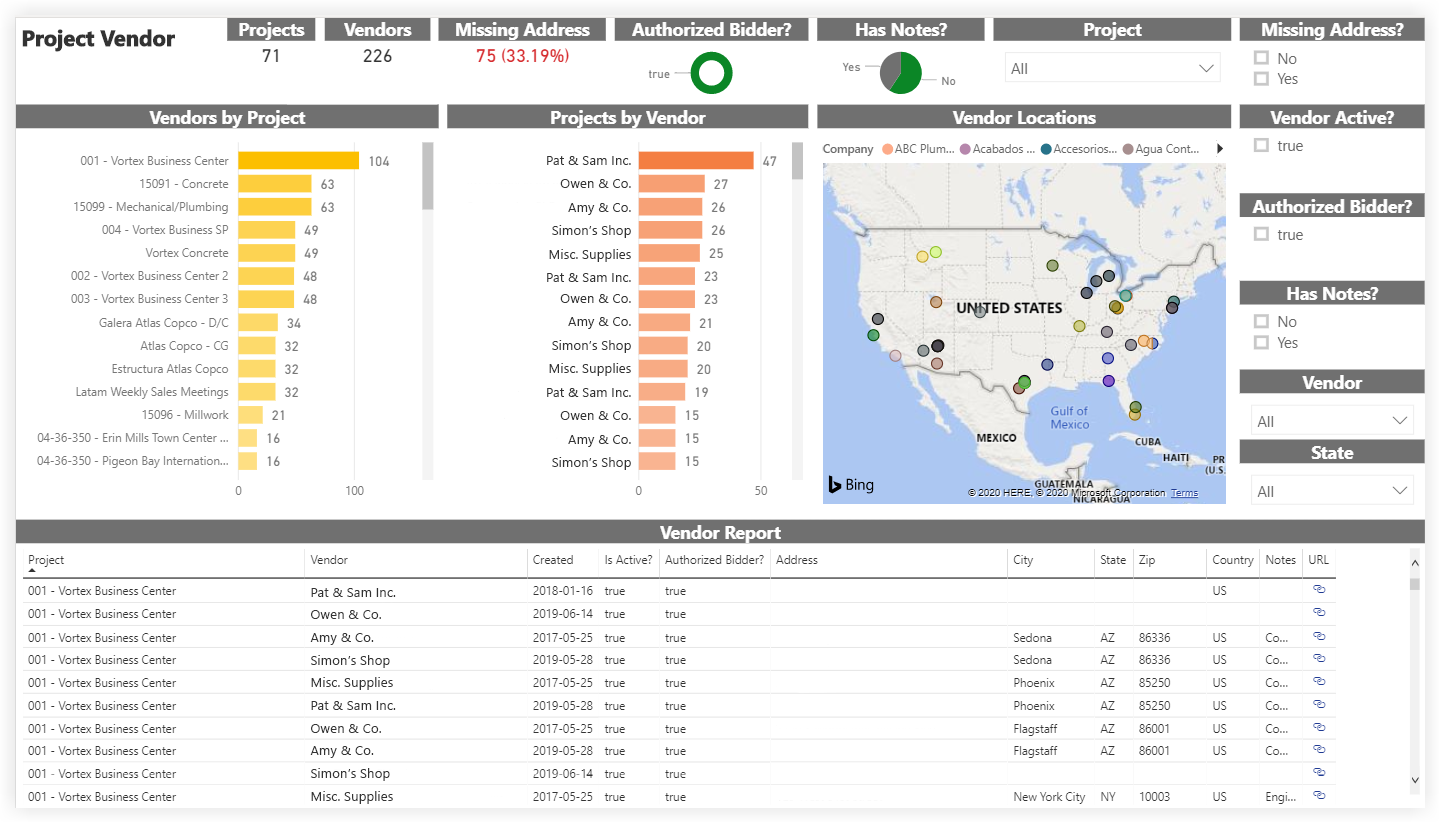
As part of the Analytics Project Management Report, the Project Vendor report page includes the number of companies added to each project and the number of projects each company has been added to.
Sample Report Page
This sample report page was created using mock data for demonstration purposes only.
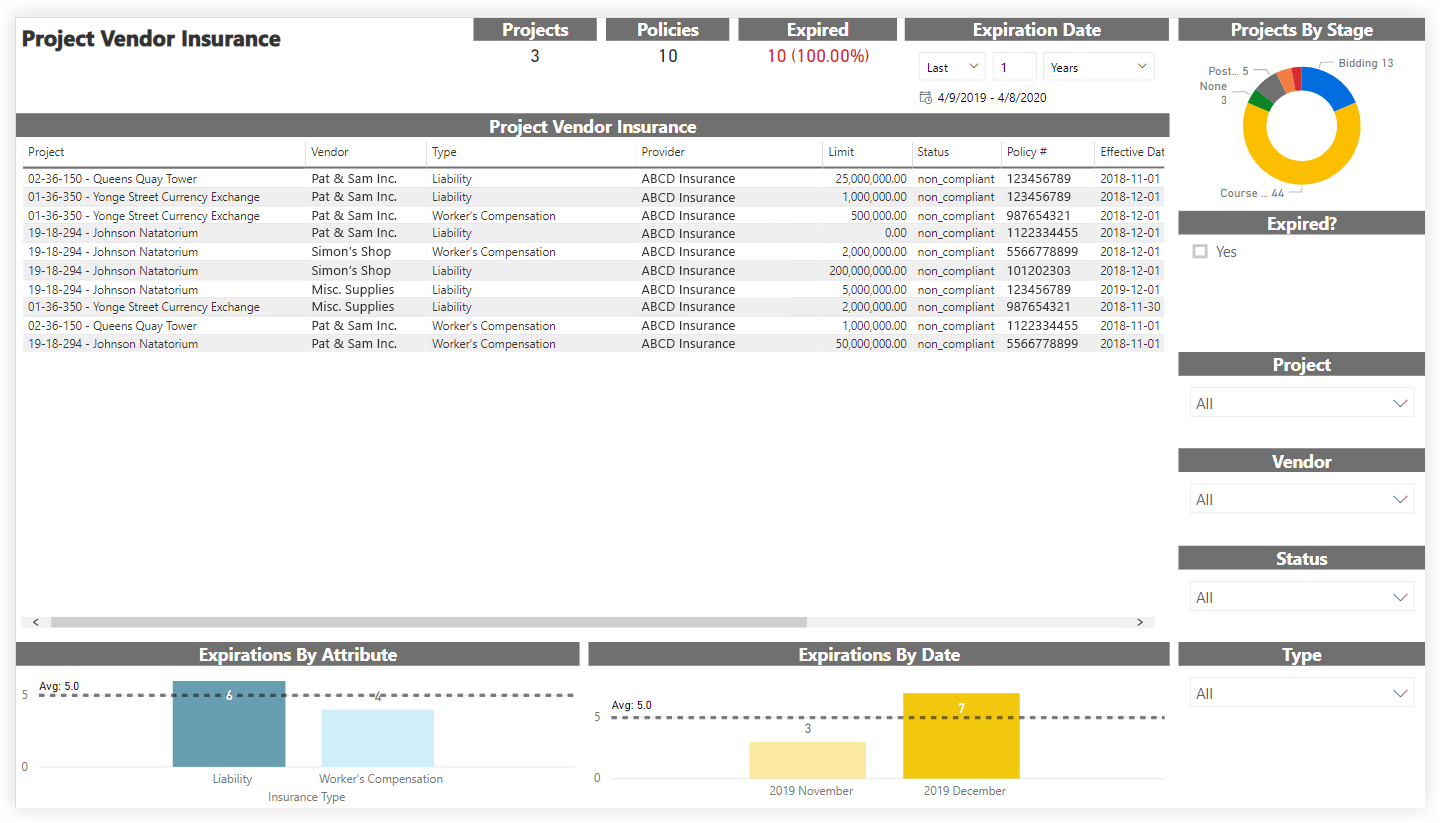
Project Vendor Insurance
Summary
As part of the Analytics Project Management Report, the Project Insurance report page outlines the Project level insurance information for each company in each project.
Sample Report Page
This sample report page was created using mock data for demonstration purposes only.
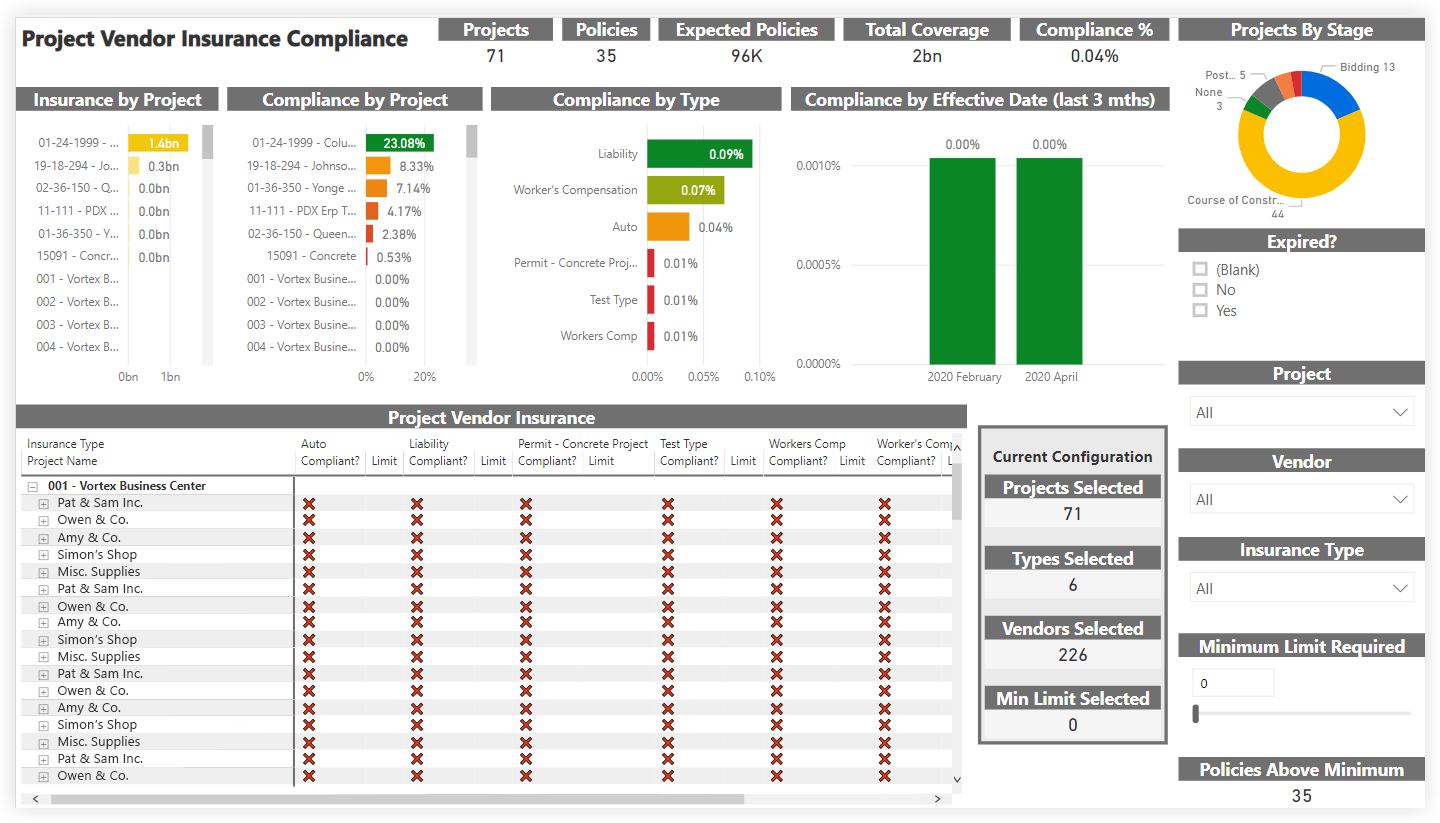
Project Vendor Insurance Compliance
Summary
As part of the Analytics Project Management Report, the Project Vendor Insurance Compliance report page allows users to audit the Project level insurance compliance for each company in each project. Adjusting the 'Minimum Limit Required' slicer immediately updates the compliance data in the other visuals in the report page based on the amount set.
Sample Report Page
This sample report page was created using mock data for demonstration purposes only.
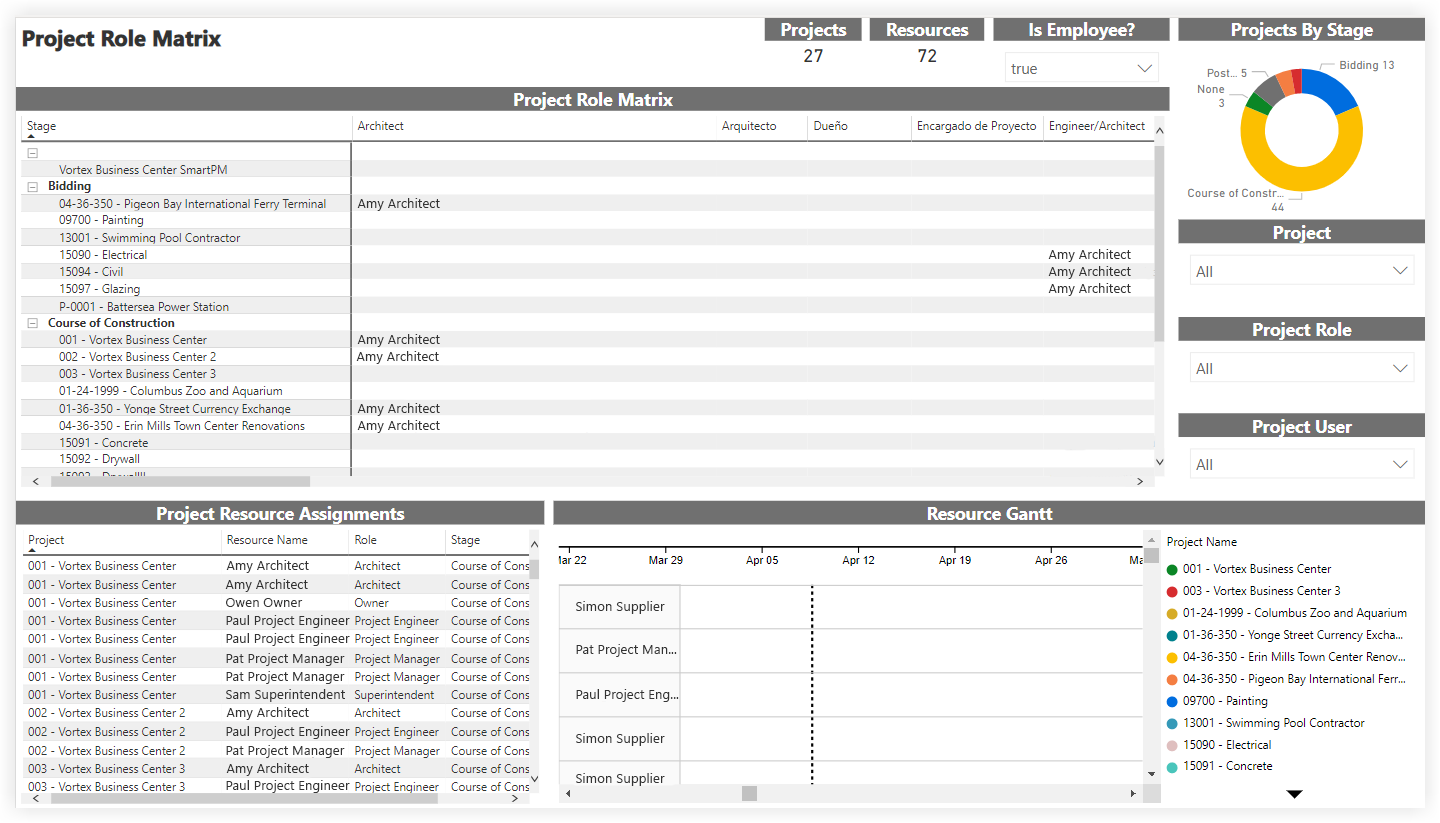
Project Role Matrix
Summary
As part of the Analytics Project Management Report, the Project Role Matrix report page shows the users assigned to each role and the resource assignments for every project.
Sample Report Page
This sample report page was created using mock data for demonstration purposes only.
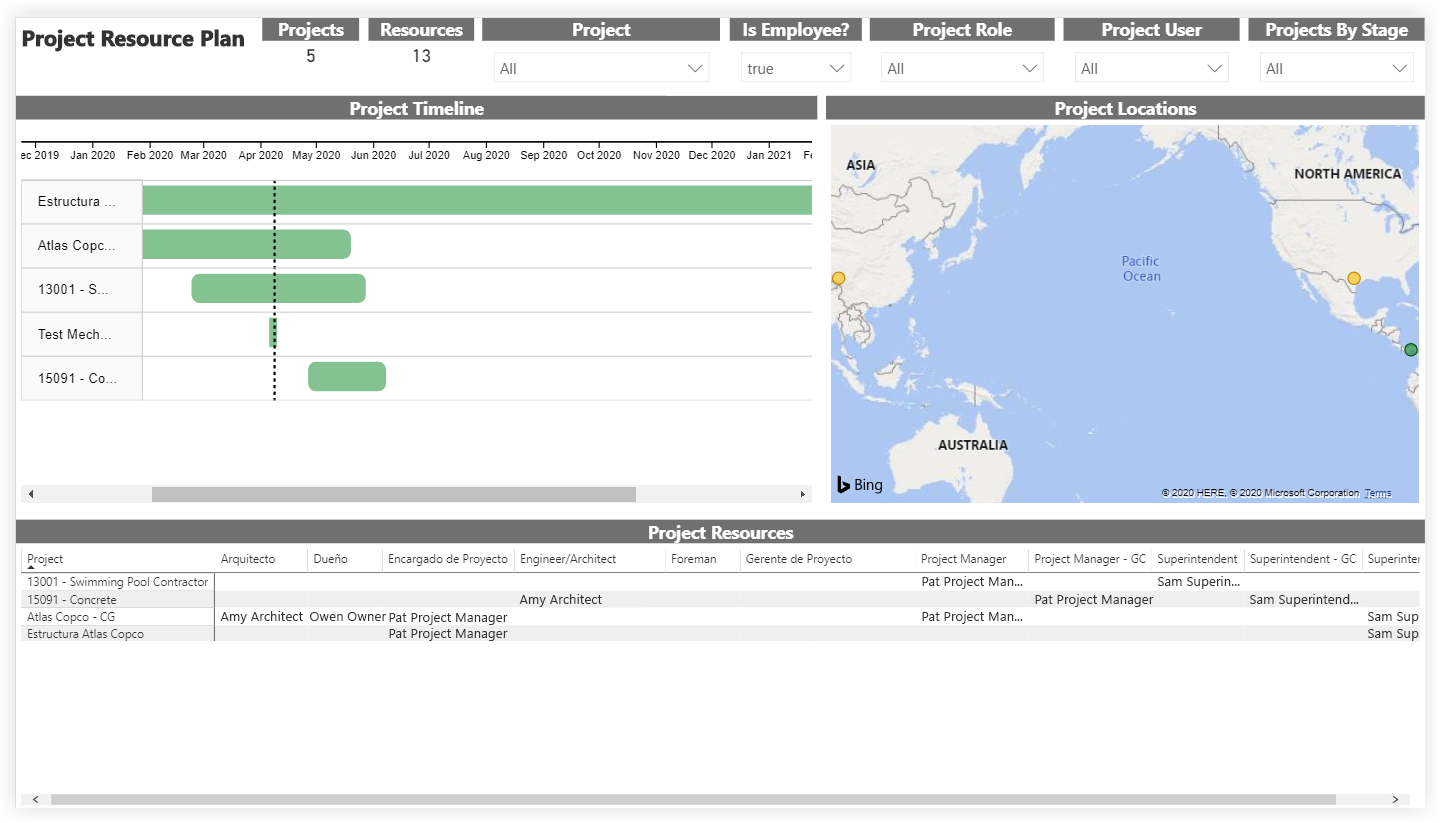
Project Resource Plan
Summary
As part of the Analytics Project Management Report, the Project Resource Plan report page provides a timeline view for all projects based on their start dates and their estimated durations. The 'Project Resources' table lists key project members including users designated as project managers, foremen, and superintendents.
Sample Report Page
This sample report page was created using mock data for demonstration purposes only.
Schedule Task Insights
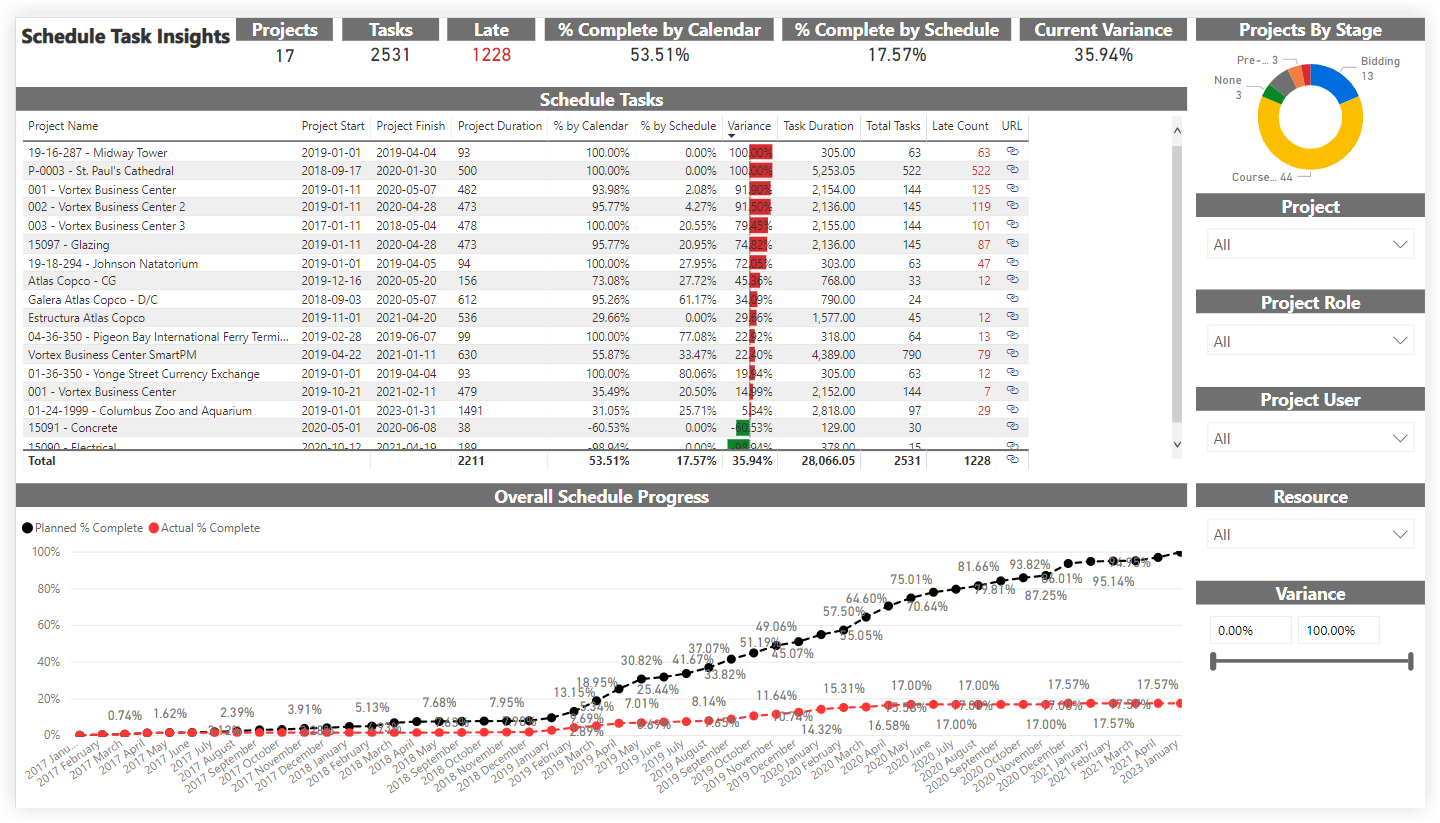
Summary
As part of the Analytics Project Management Report, the Schedule Task Insights report page provides a dashboard style view of each project's overall progress on their schedules.
Sample Report Page
This sample report page was created using mock data for demonstration purposes only.
Schedule Task Status
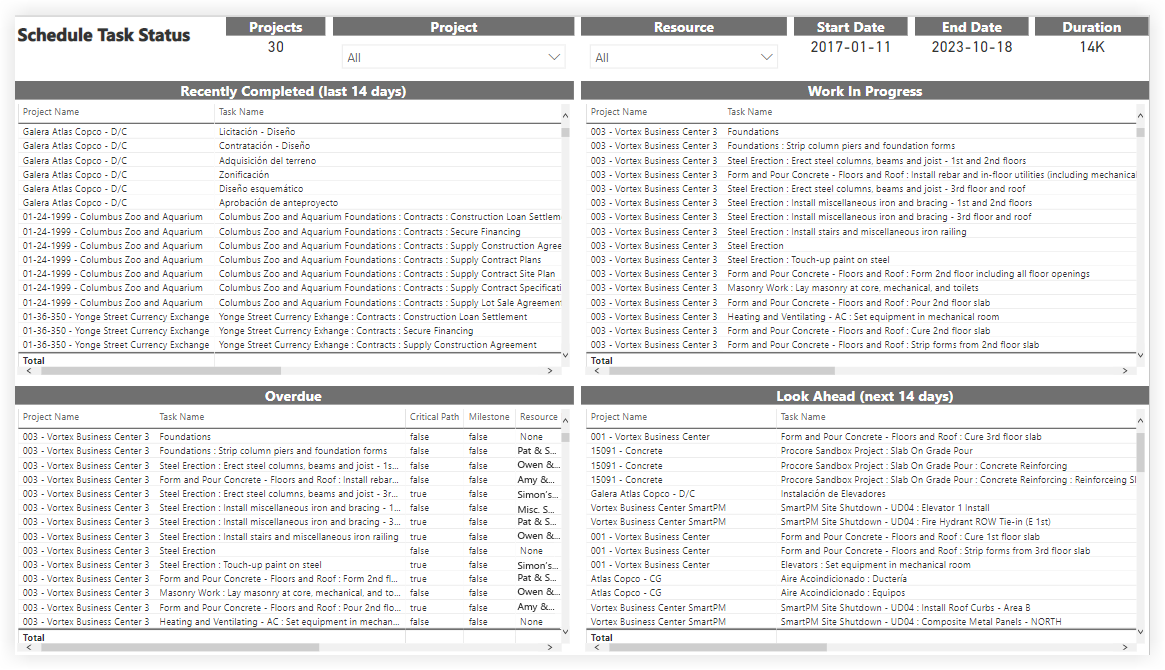
Summary
As part of the Analytics Project Management Report, the Schedule Task Status report page organizes schedule tasks into the following groups: Recently Completed, Work In Progress, Overdue, and Look Ahead.
Sample Report Page
This sample report page was created using mock data for demonstration purposes only.
Schedule Task Gantt
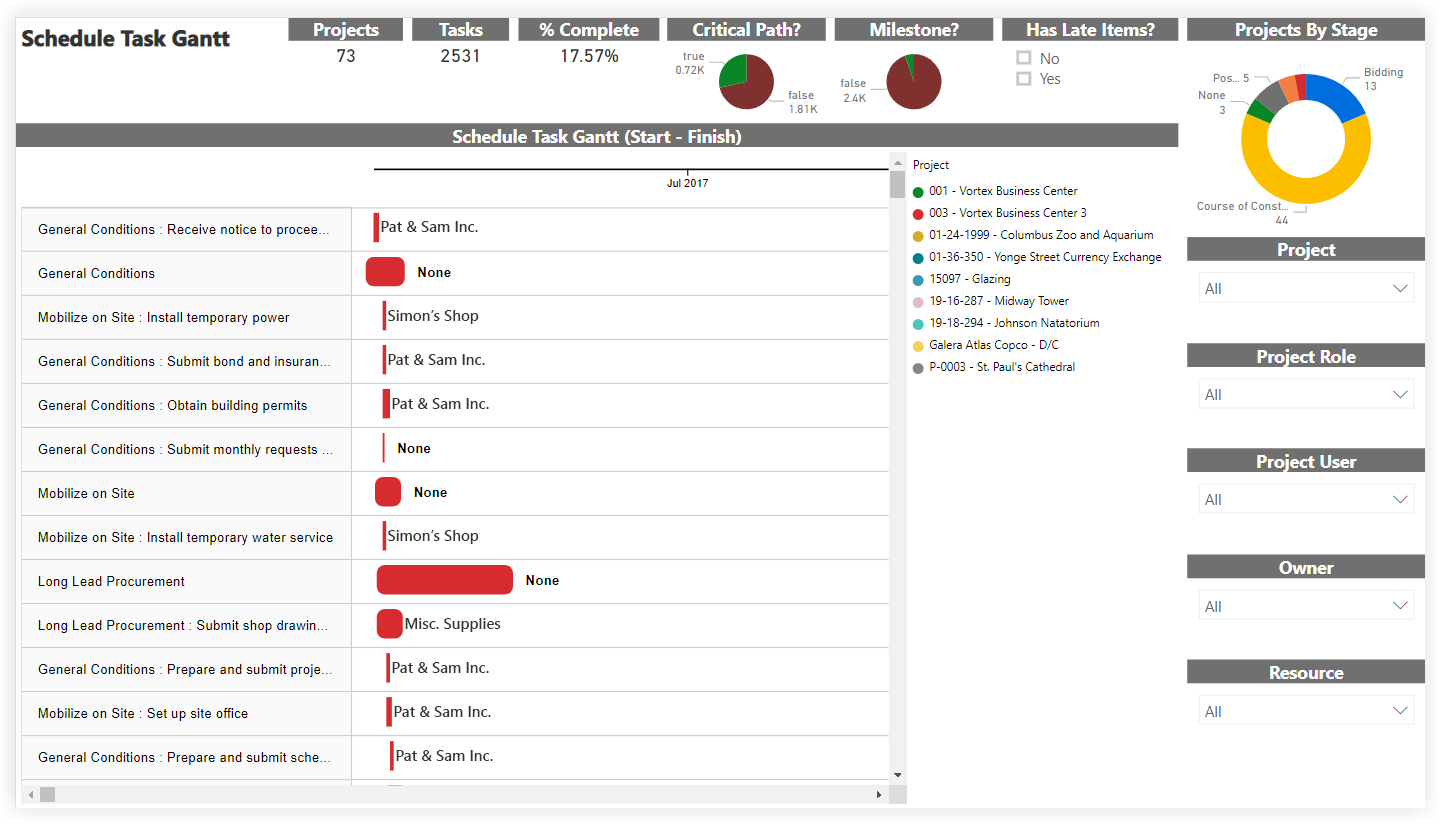
Summary
As part of the Analytics Project Management Report, the Schedule Task Gantt report page provides a Gantt view of the schedule tasks on each project.
Sample Report Page
This sample report page was created using mock data for demonstration purposes only.
Schedule Tasks
Summary
As part of the Analytics Project Management Report, the Schedule Tasks report page summarizes information on the schedule tasks on each project in a list view.
Sample Report Page

This sample report page was created using mock data for demonstration purposes only.
Schedule ToDo Gantt
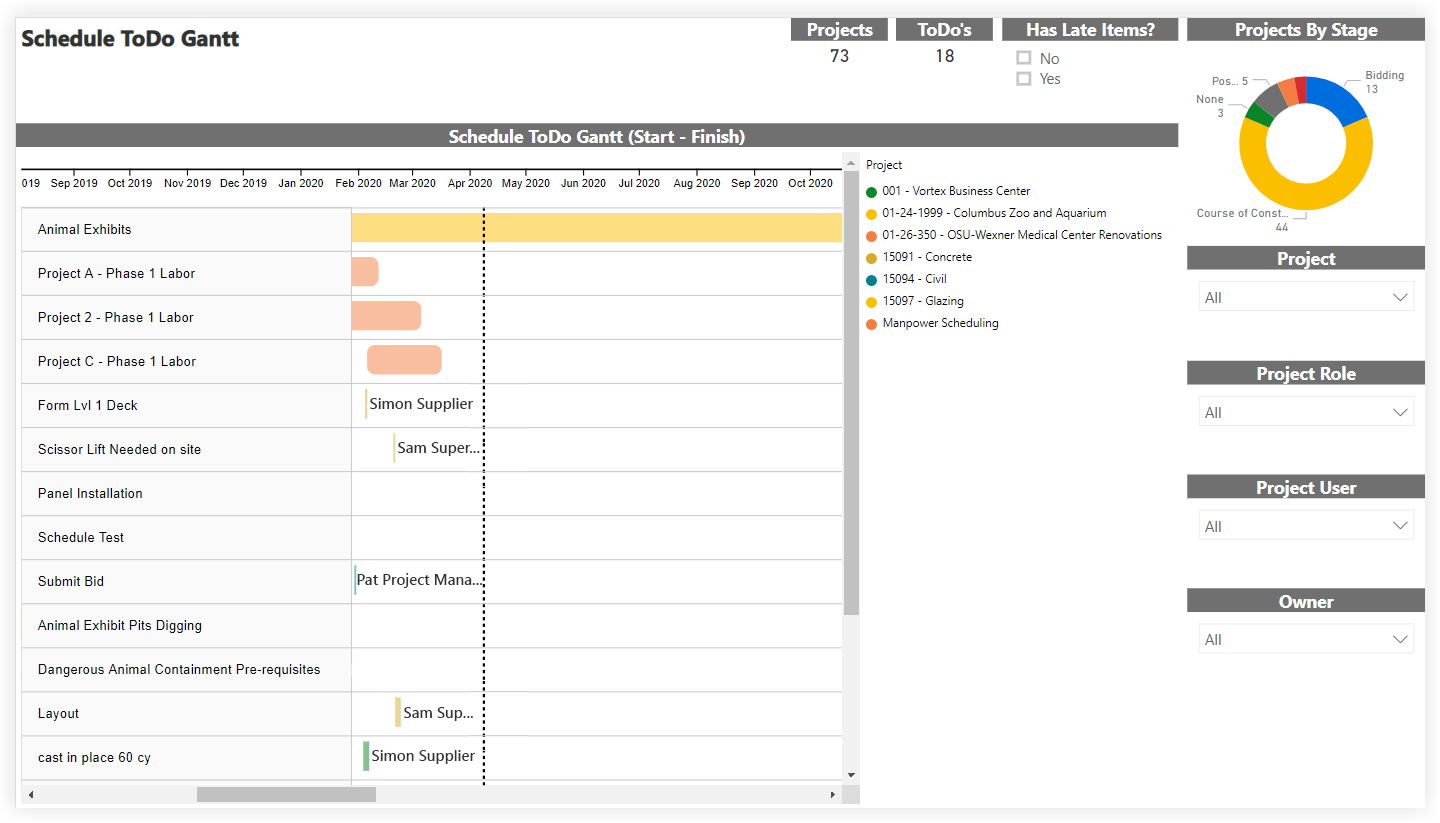
Summary
As part of the Analytics Project Management Report, the Schedule ToDo Gantt report page provides a Gantt view of the calendar items added to each project's Schedule tool in Procore.
Sample Report Page
This sample report page was created using mock data for demonstration purposes only.
Schedule ToDos
Summary
As part of the Analytics Project Management Report, the Schedule ToDos report page provides a summary of all calendar items added to each project's Schedule tool in Procore.
Sample Report Page

This sample report page was created using mock data for demonstration purposes only.
Meetings
Summary
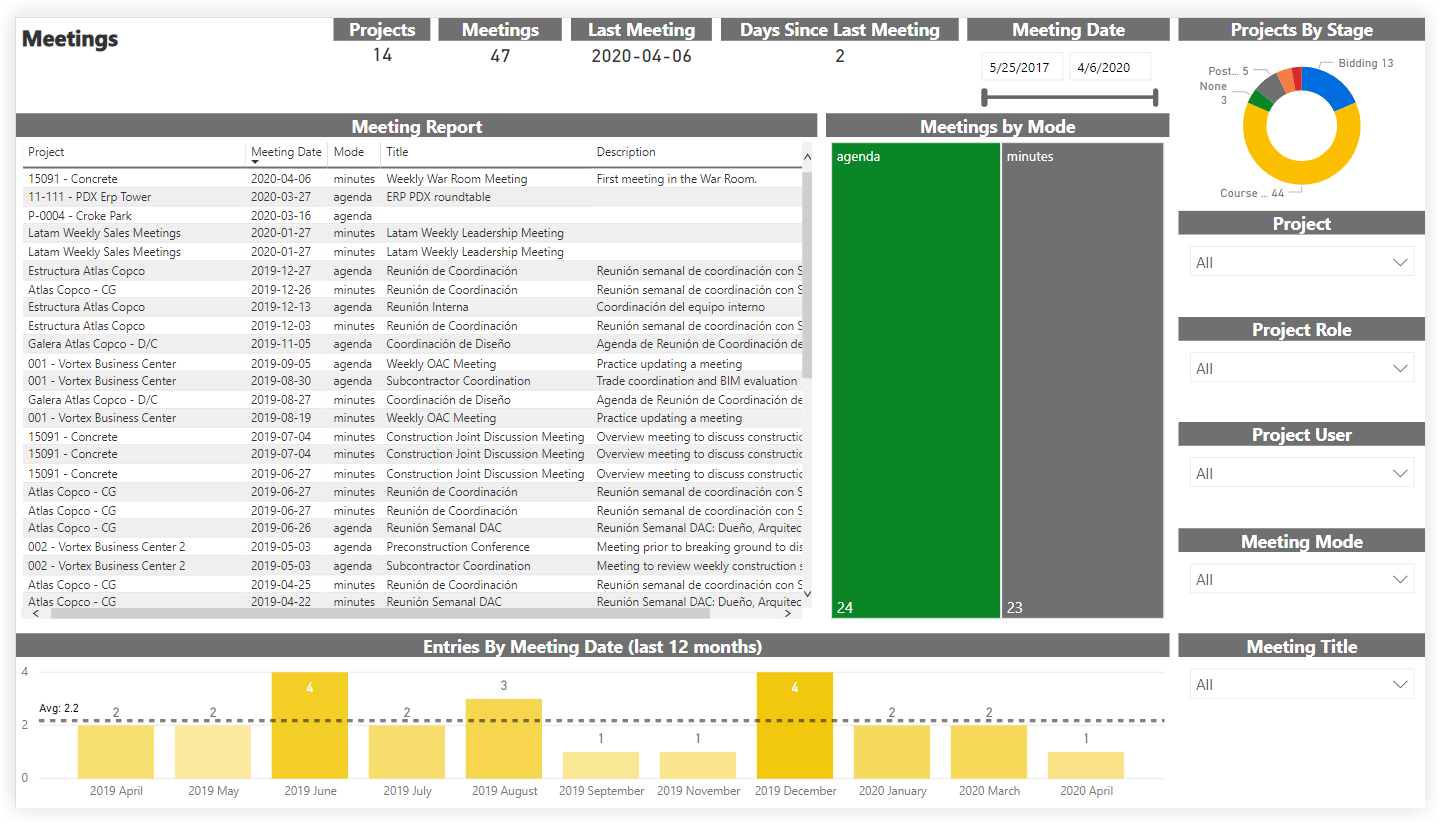
As part of the Analytics Project Management Report, the Meetings report page includes basic information about all meeting records for every project.
Sample Report Page
This sample report page was created using mock data for demonstration purposes only.
Drawing Revisions
Summary
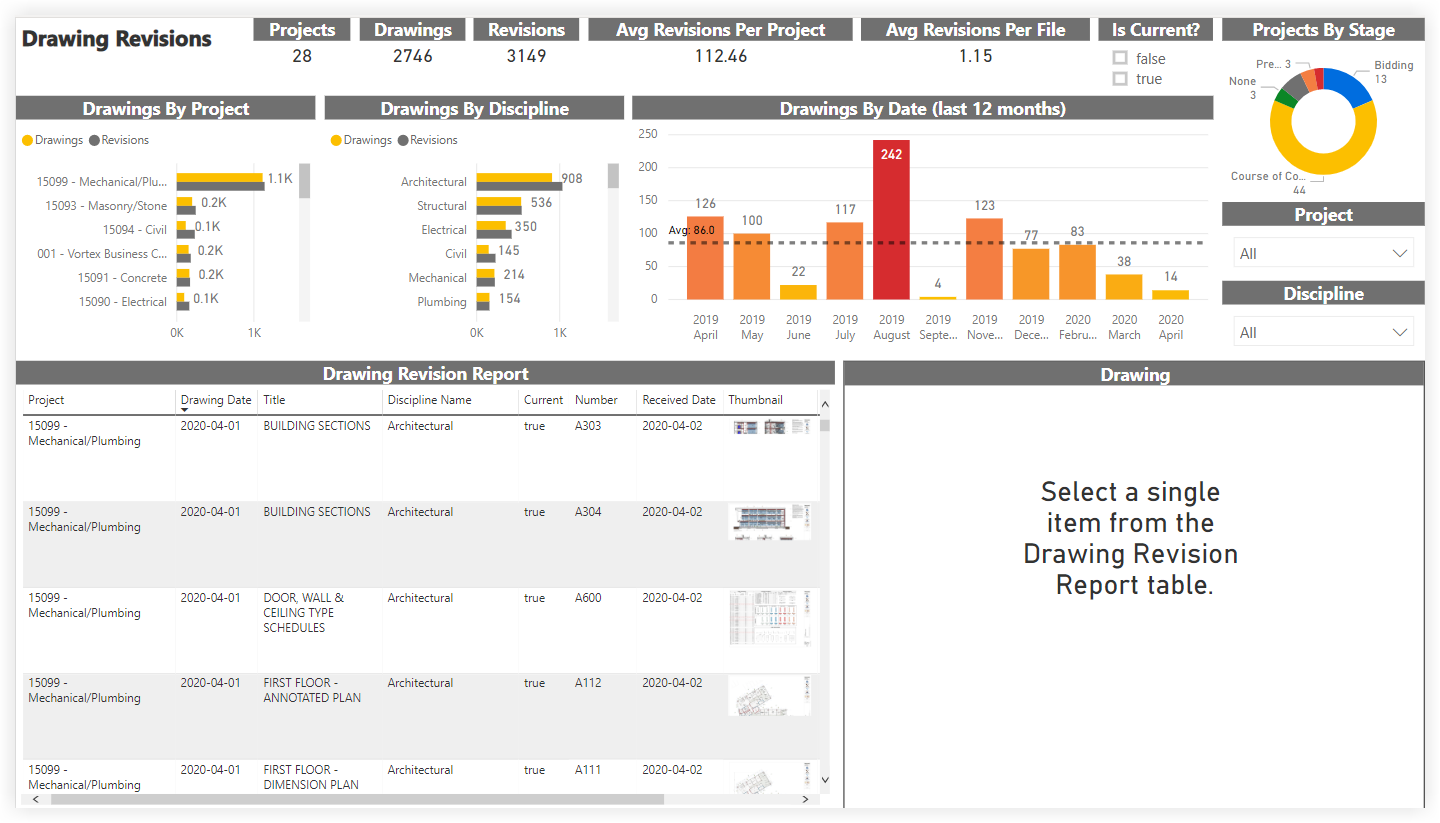
As part of the Analytics Project Management Report, the Drawings Revision report page shows detailed information about each drawing revision in each project. Drawings can be selected from the 'Drawing Revision Report' list and previewed directly in the report page under the 'Drawing' visual.
Sample Report Page
This sample report page was created using mock data for demonstration purposes only.
Photos
Summary
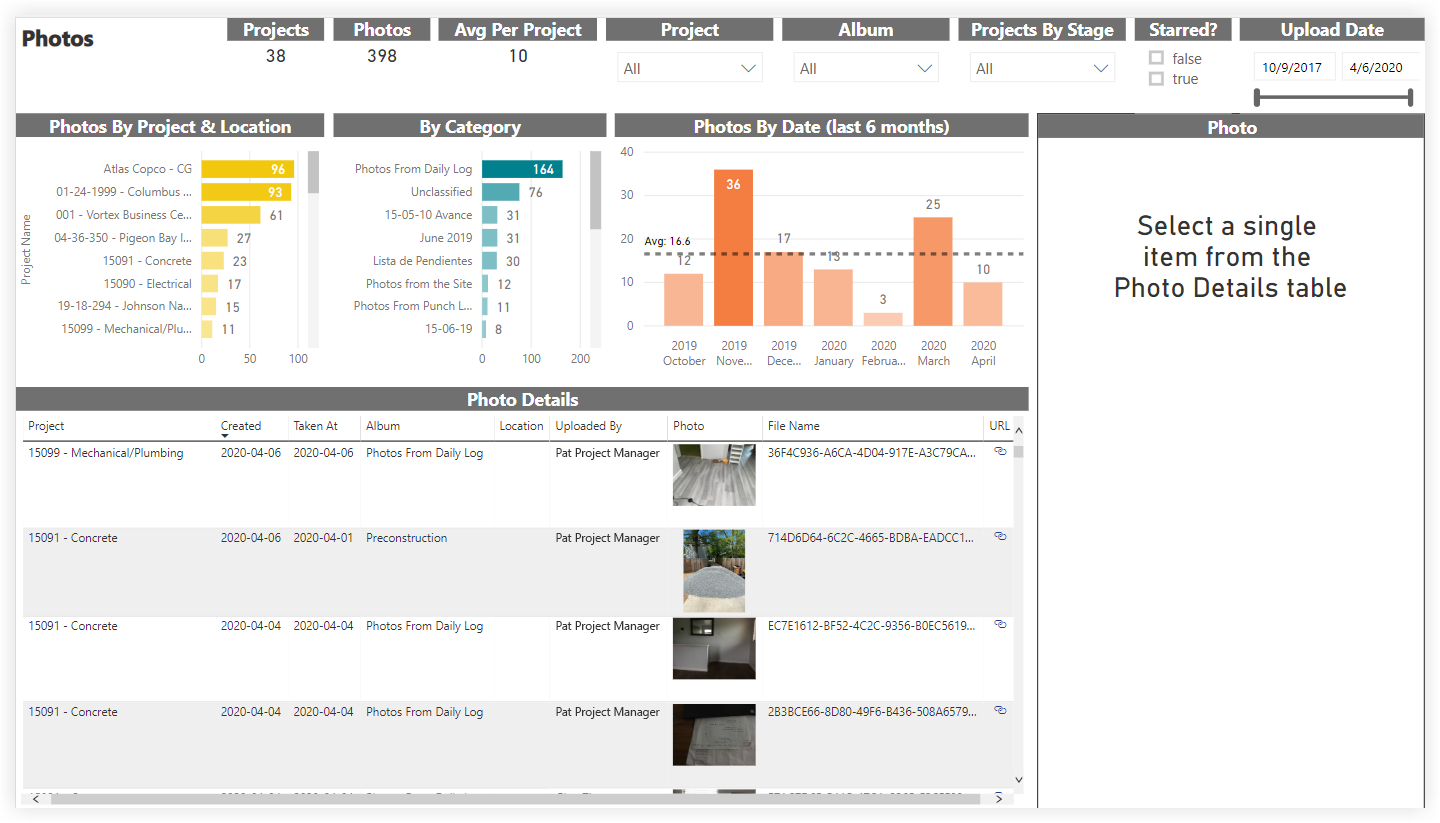
As part of the Analytics Project Management Report, the Photos report page shows all items from the Photos tool in every project. Photos can be selected from the 'Photo Details' list and previewed directly in the report page under the 'Photo' visual.
Sample Report Page
This sample report page was created using mock data for demonstration purposes only.
RFI Insights
Summary
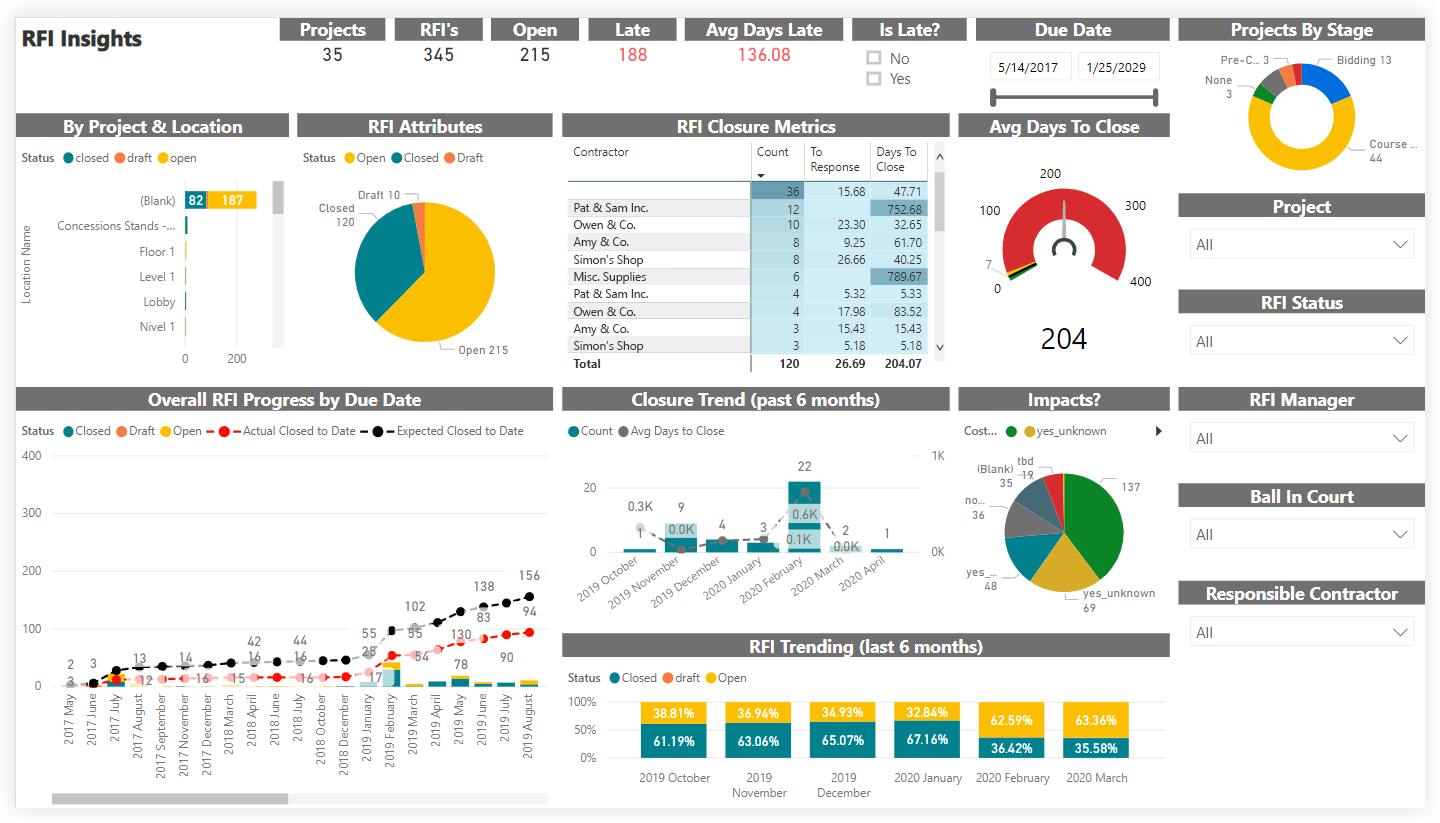
As part of the Analytics Project Management Report, the RFI Insights report page tracks key metrics covering overall RFI progress and can be utilized as an RFI dashboard. The 'RFI Closure Metrics' visual shows the number of RFIs, average days to respond, and average days to close for each responsible contractor.
Sample Report Page
This sample report page was created using mock data for demonstration purposes only.
RFIs
Summary
As part of the Analytics Project Management Report, the RFIs report page includes basic information about all RFIs for every project.
Sample Report Page

This sample report page was created using mock data for demonstration purposes only.
Submittal Insights
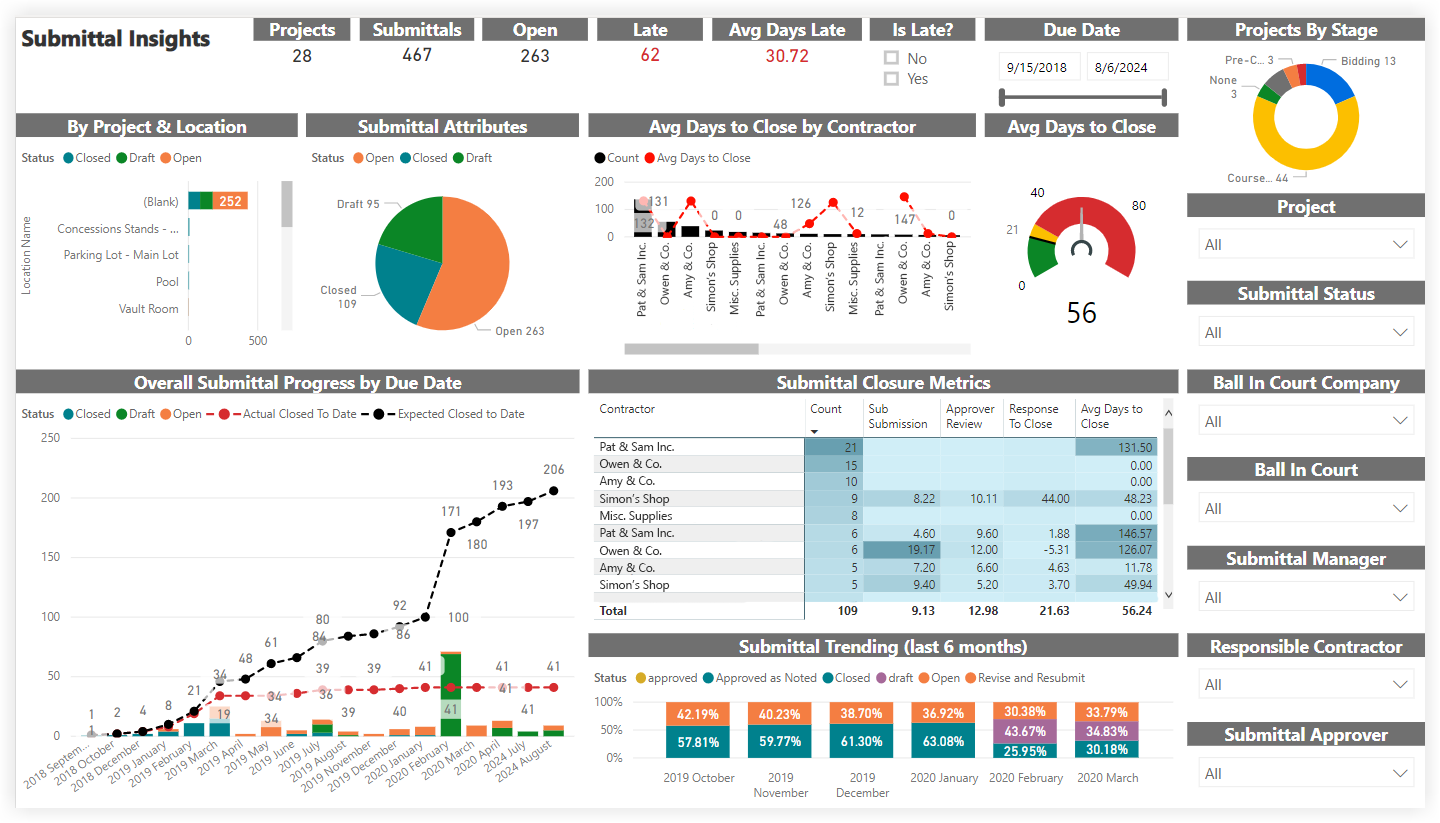
Summary
As part of the Analytics Project Management Report, the Submittal Insights report page tracks key metrics covering overall submittal progress and can be utilized as a submittal dashboard. The 'Submittal Closure Metrics' visual shows the number of submittals, average days to submit, average days to respond, average days from response to close, average days to close for each responsible contractor.
Sample Report Page
This sample report page was created using mock data for demonstration purposes only.
Submittals
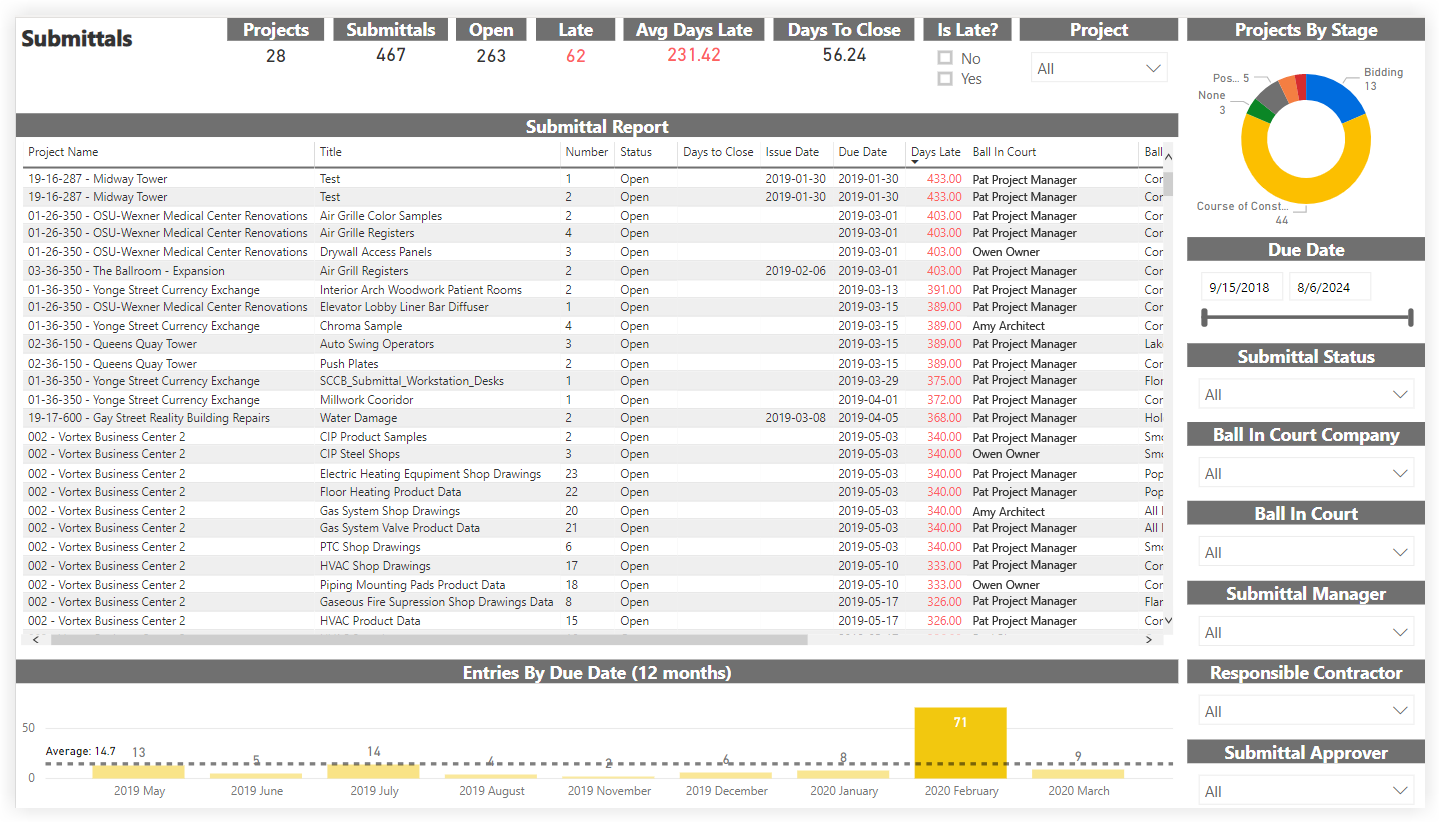
Summary
As part of the Analytics Project Management Report, the Submittals report page includes basic information about all submittals for every project.
Sample Report Page
This sample report page was created using mock data for demonstration purposes only.
Submittal Approvers
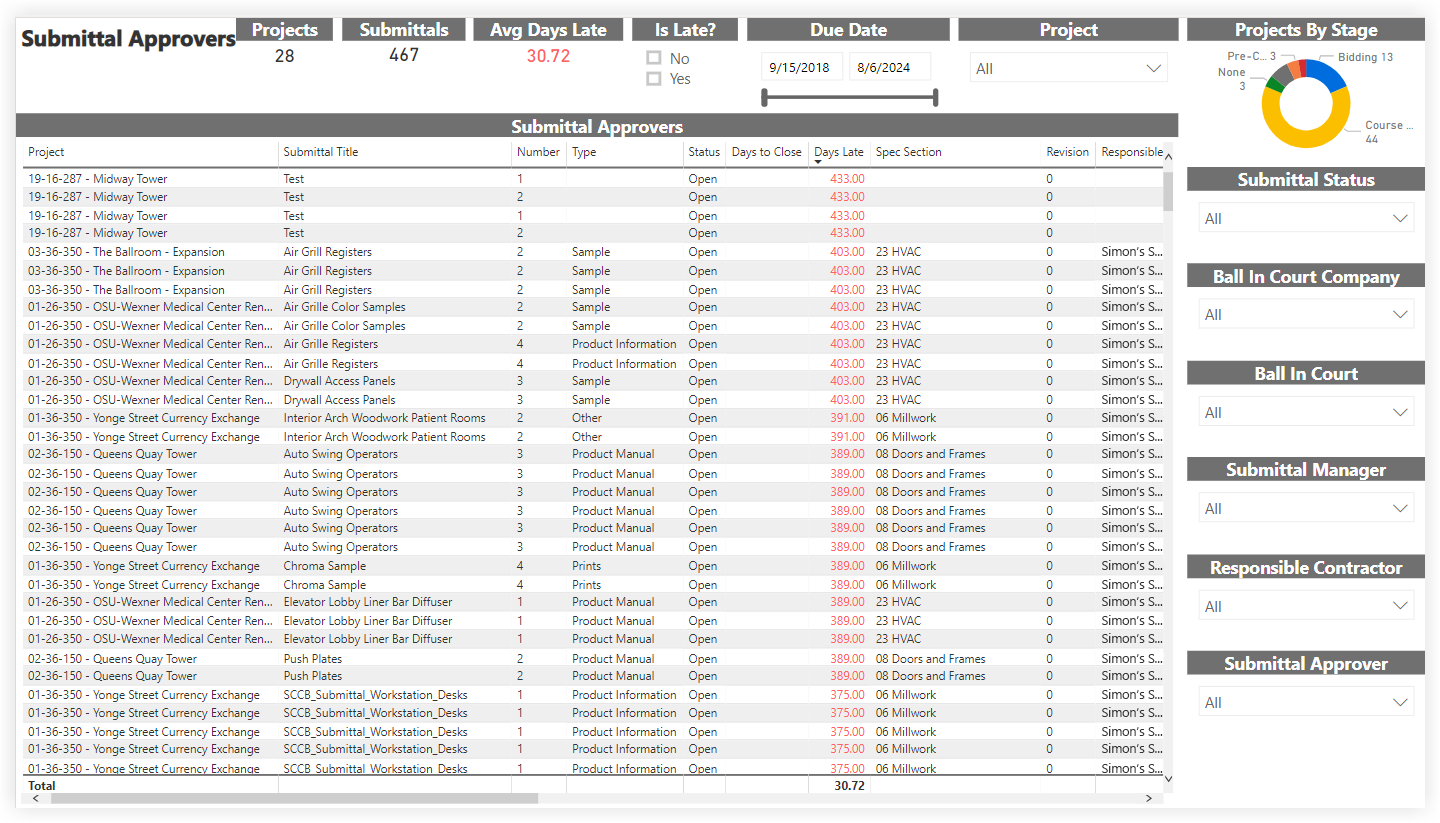
Summary
As part of the Analytics Project Management Report, the Submittal Approvers report page shows information about each step in each submittal's workflow.
Sample Report Page
This sample report page was created using mock data for demonstration purposes only.
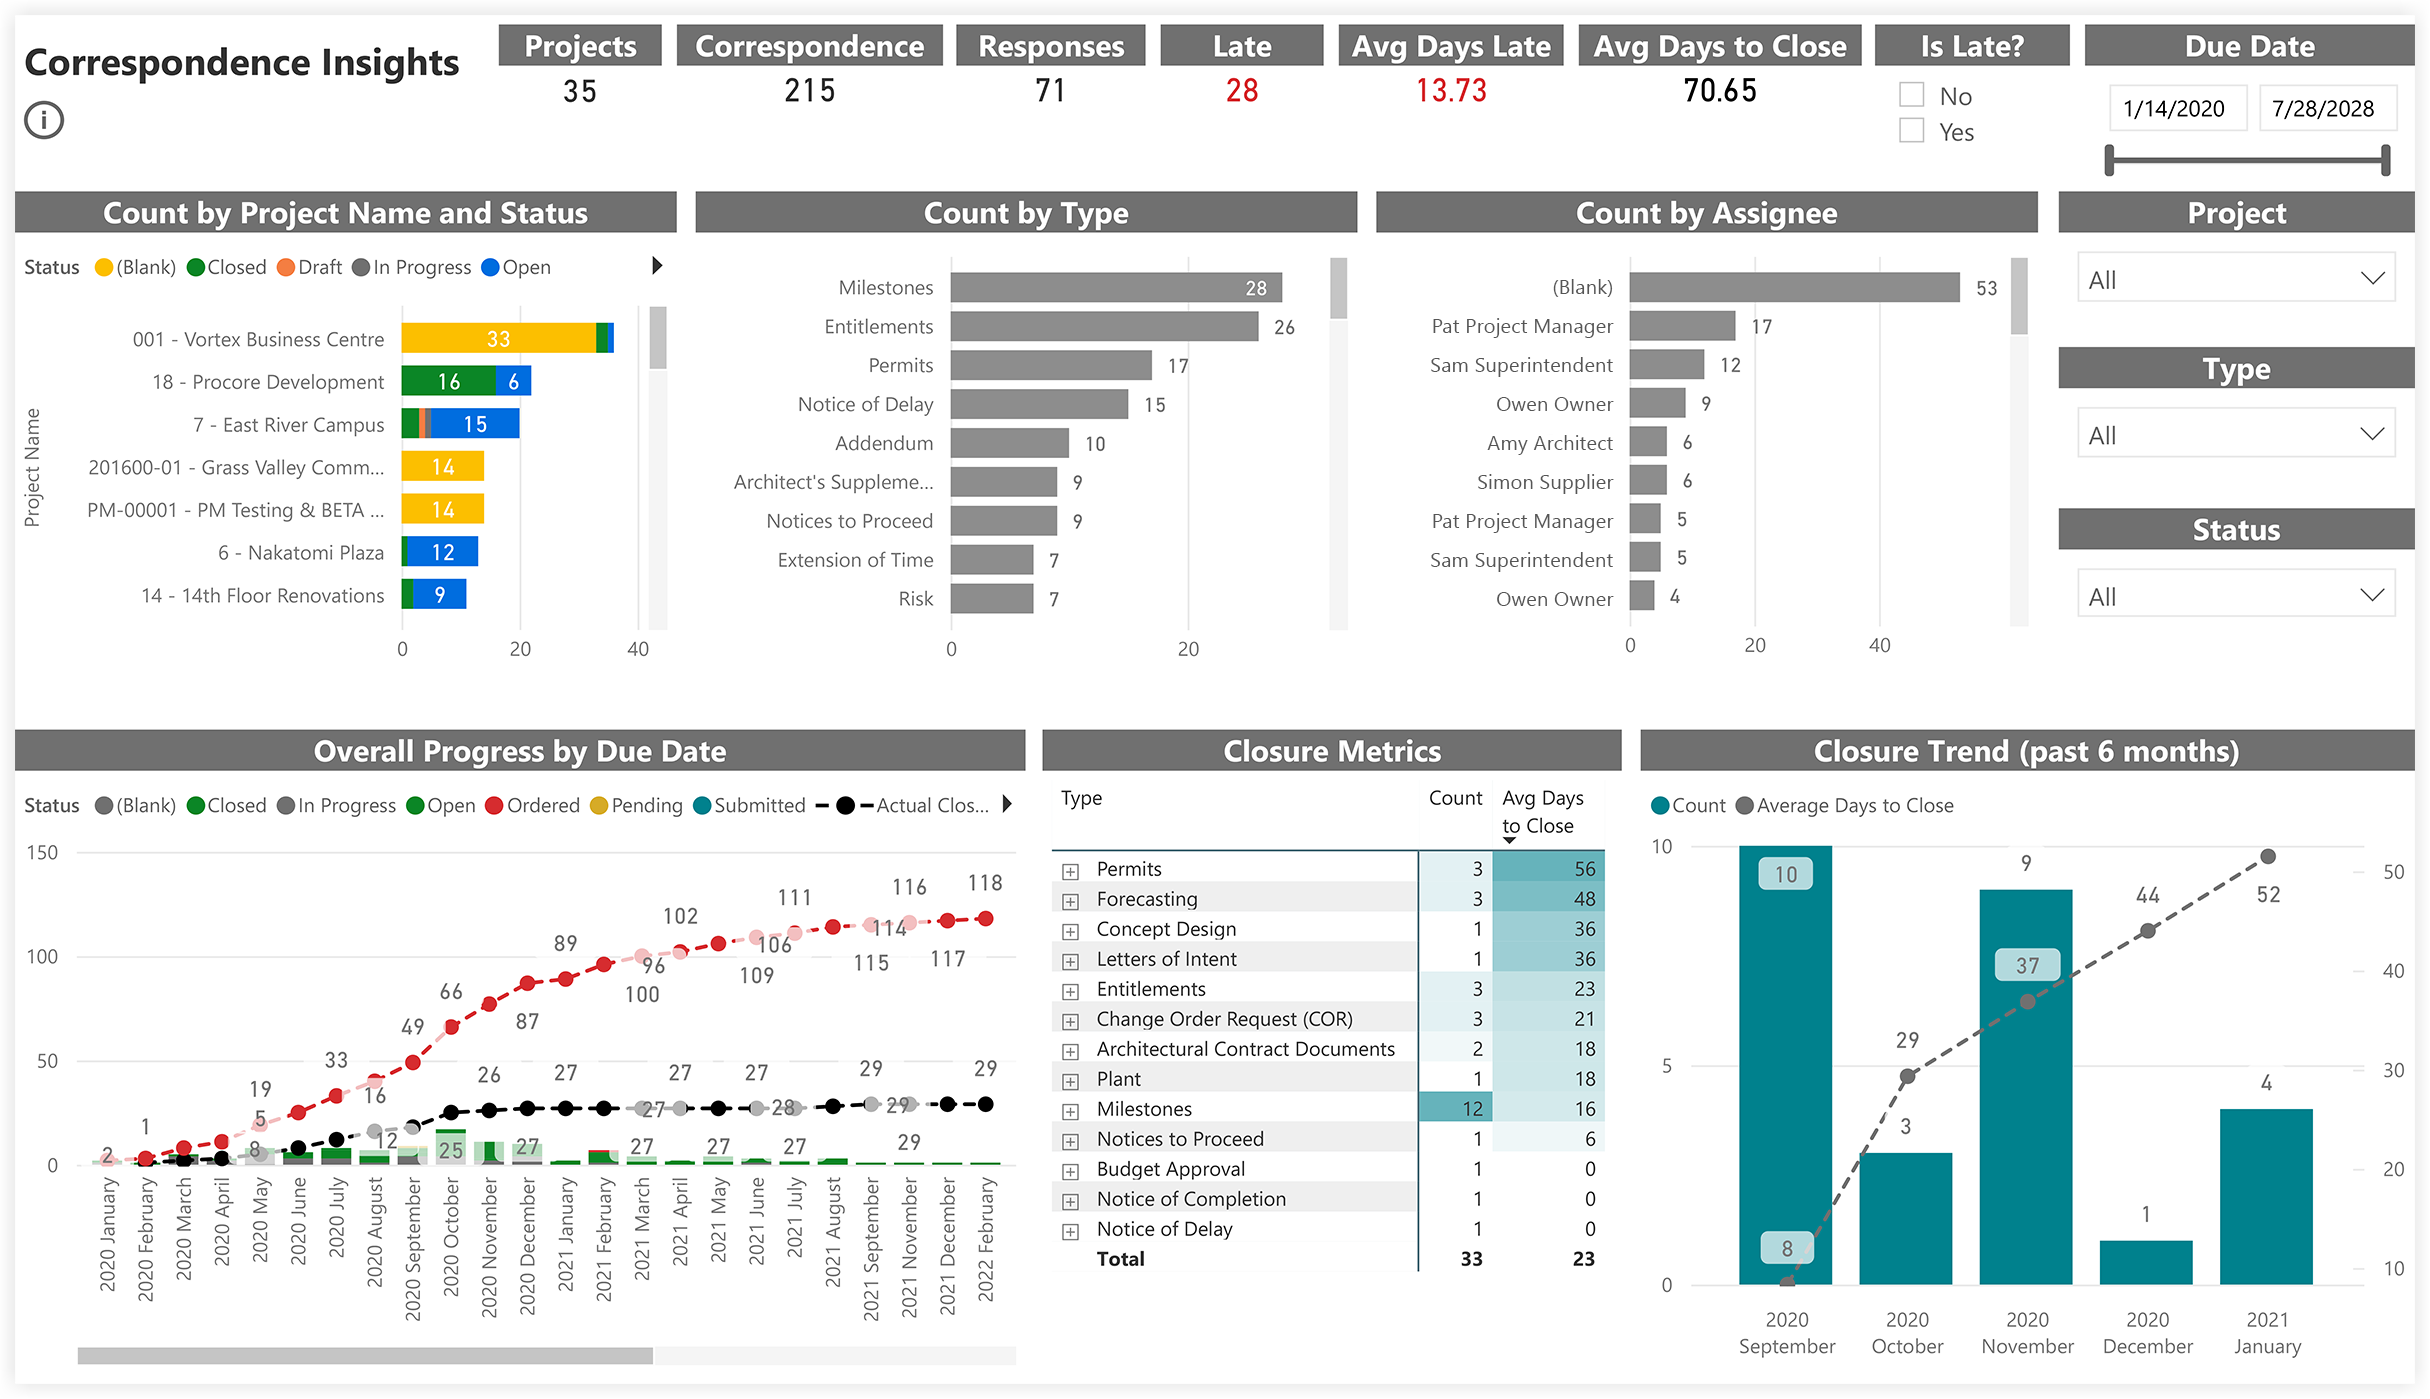
Correspondence Insights
Sample Report Page
This sample report page was created using mock data for demonstration purposes only.
Correspondences
Sample Report Page
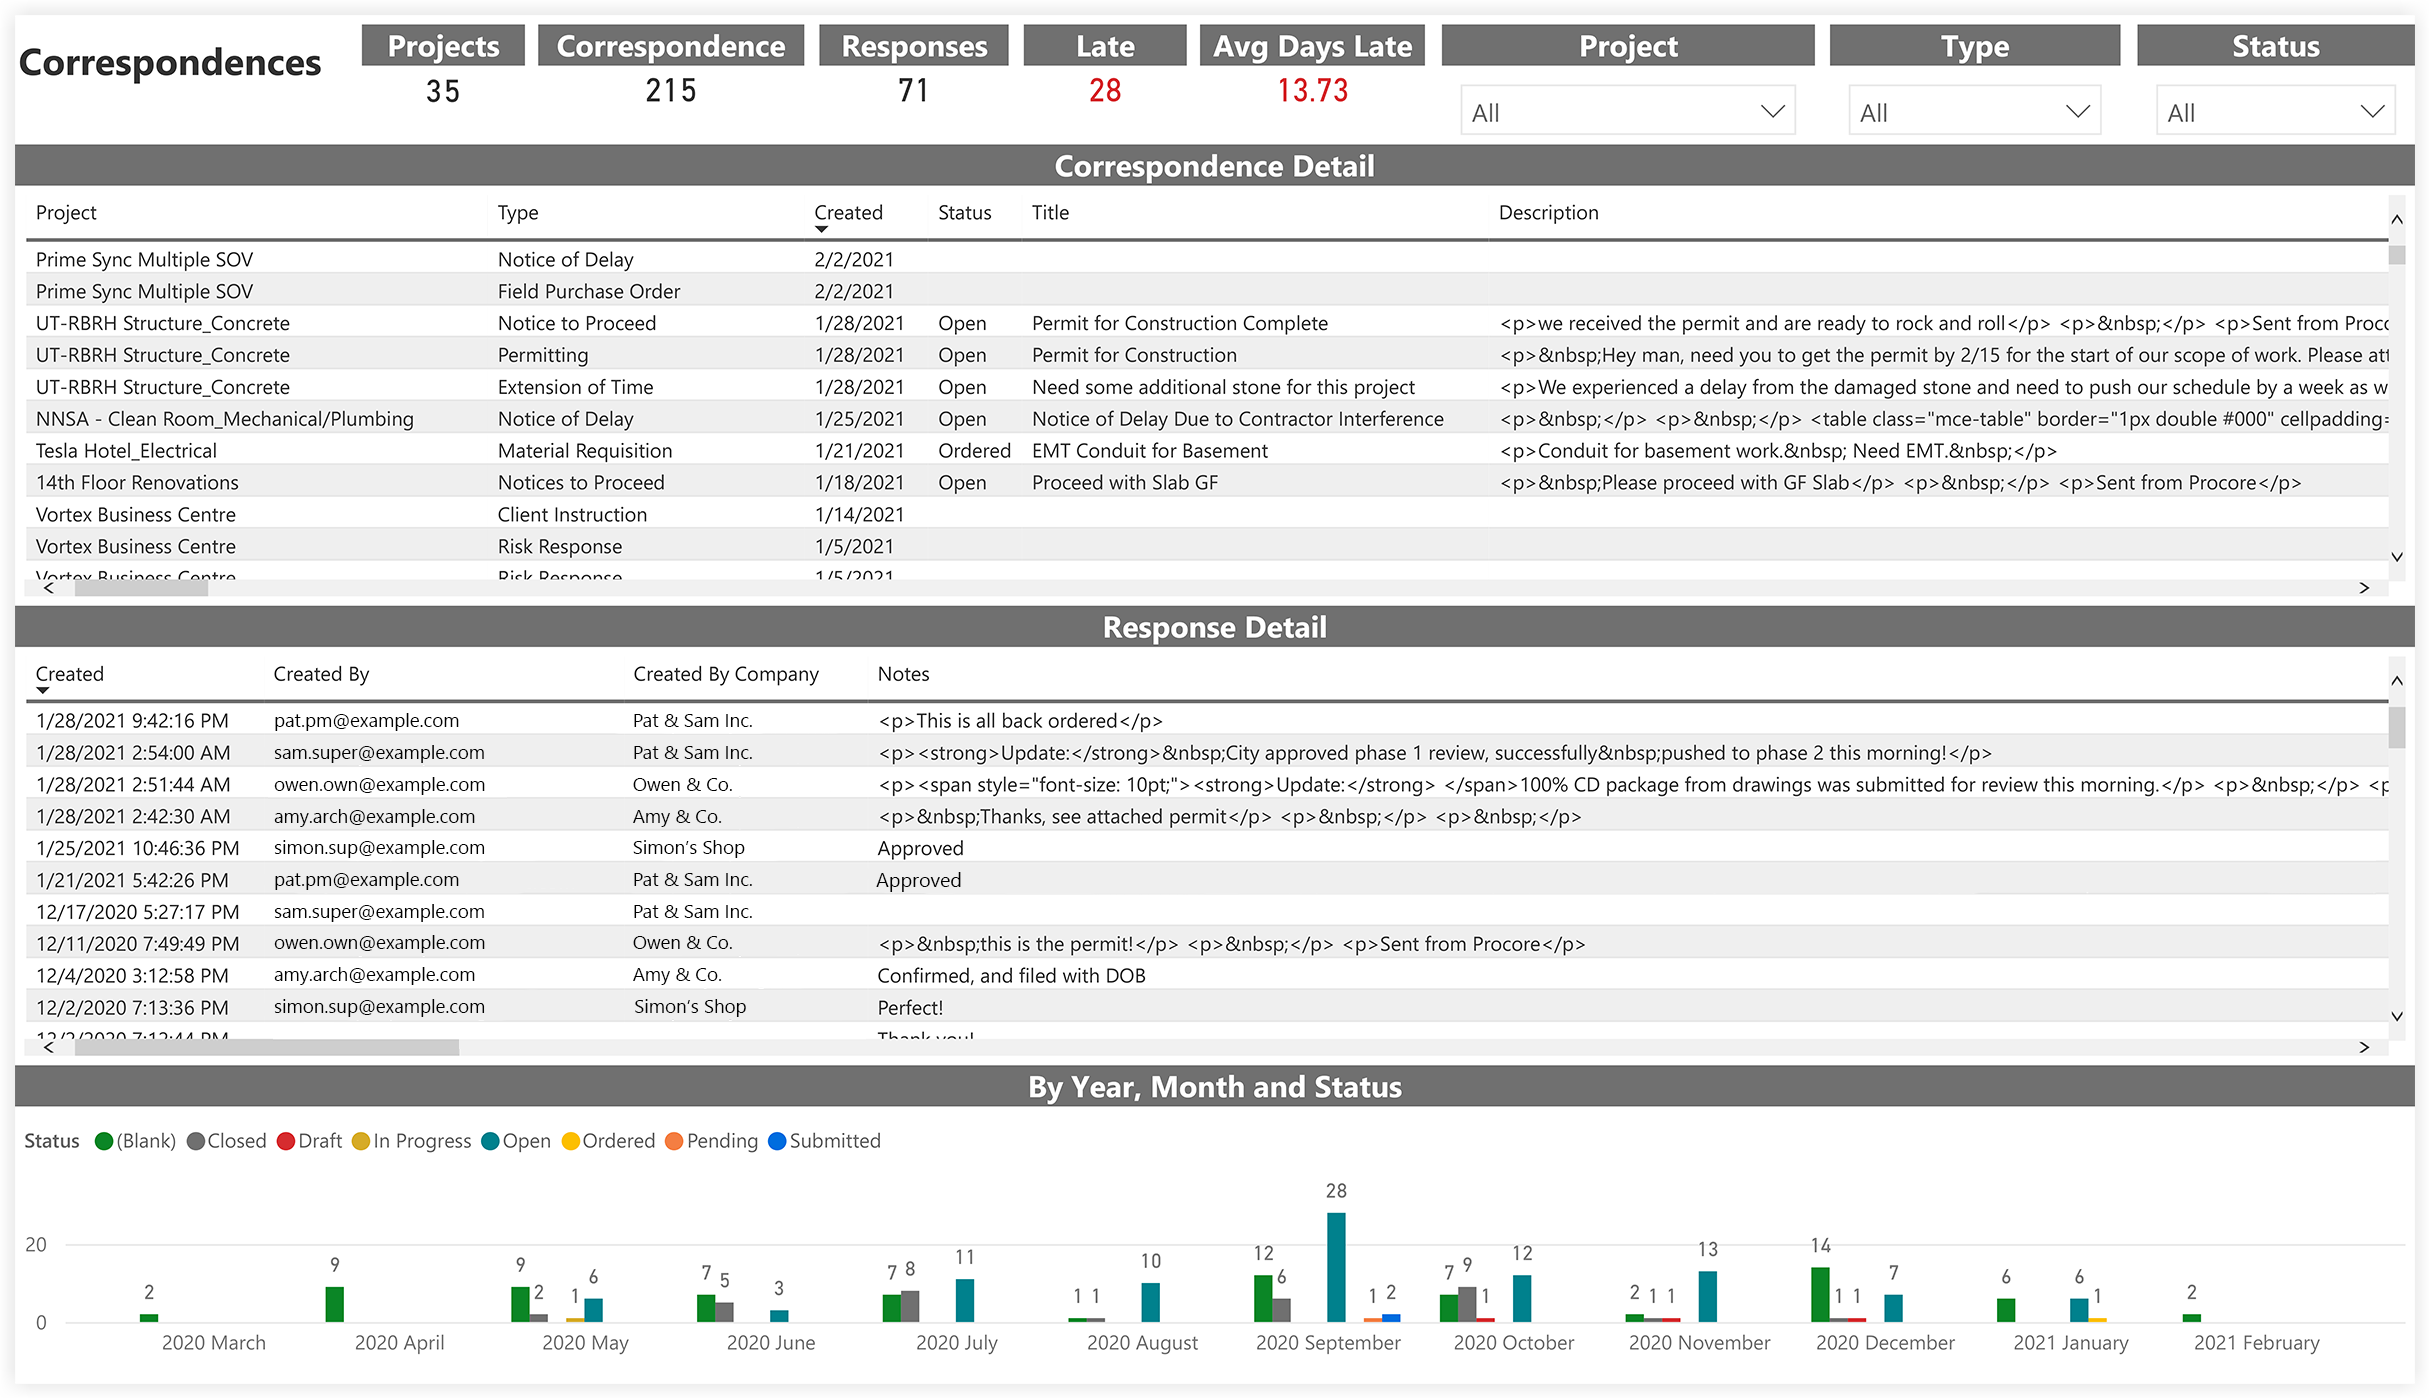
This sample report page was created using mock data for demonstration purposes only.