View a Gantt Schedule
Objective
To view a Gantt schedule in the project's Schedule tool.
Things to Consider
- Required User Permissions:
- 'Read Only' or higher permissions on the project's Schedules tool.
- Additional Information:
- The Search bar is not available when viewing the schedule in the Gantt view.
- Schedule Tasks are read-only calendar events that are imported in an integrated project scheduled (e.g. MS Project, Primavera P6, etc.).
Steps
- Navigate to the project's Schedule tool.
- Click the Gantt tab.
Note: You will see a Gantt chart with horizontal bars that illustrate the amount of work done relative to the amount of time given to complete that task as well as the dependencies between schedule tasks.
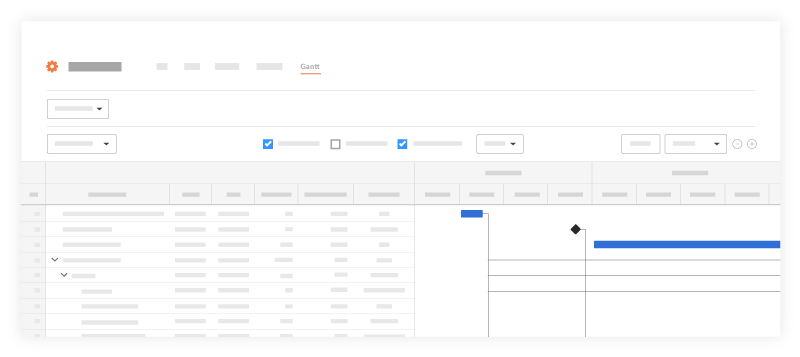
The following colors and shapes can be seen on the Gantt chart:
Note: When Percent (%) Complete is enabled, the color of the bars will have a lower saturation of color to indicate the percentage that is complete.- Red: Critical
- Blue: Non-Critical
- Black: Summary task
- Grey Hatch Pattern: Baselines compare to the master schedule
- Diamond Shape: Milestone Task
The following options are available when viewing a Gantt chart:
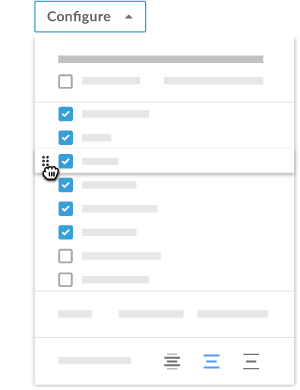
Configure Columns
- Click the Configure drop-down menu.
- Choose which columns you want included on the Gantt chart:
- Mark the checkbox next to each option you want to see as a column.
Tip! Click Select All to show all columns on the schedule. - Clear the checkboxes next to any options you want to hide.
- Columns can be sorted from low to high and high to low or A to Z and Z to A depending on the field type.
- Mark the checkbox next to each option you want to see as a column.
- Reorder columns on the Gantt chart:
- Hover to the left of the column name you want to move.
- Click and drag the grip
 icon to drop the column name into a new order.
- Optional: View or hide all tasks:
- To view all tasks, click Expand All.
- To hide all tasks, click Collapse All.
- Next to Row Height, click one of the line spacing options to select how much room you want between columns.
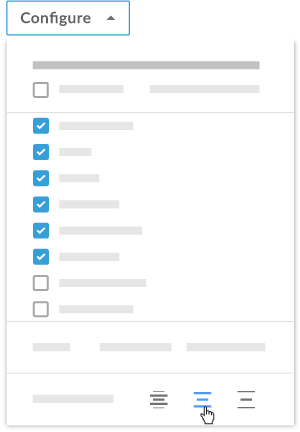
- Optional: If you want to restore all configurations back to Procore's default settings, click Reset to default in the Configure menu.
View Toggles
- Mark or clear the checkboxes next to the schedule items depending on what you want shown on the Gantt chart:
Note: Click the More drop-down menu to reveal additional options:- Critical Path
- Percent (%) Complete
- Dependencies
- Baselines
- Task Names
- Resource
Filter Options
- Click Add Filter.
- Choose from the following options to filter by:
- Date Range
- Resource
- Critical Tasks
- Summary Tasks
- Completed Tasks
- Incomplete Tasks
Zoom Levels
- Click the zoom out icon
 to zoom out of the Gantt chart and click the zoom in
  icon to zoom in on the Gantt chart.
 - Click the drop-down menu to select the timeframe shown for the schedule:
- Day: Shows schedule tasks for the day
- Week: Show schedule tasks for the week
- Month: Shows schedule tasks for the month
- Quarter: Shows schedule tasks for the quarter
- Year: Shows schedule tasks for the year
- Optional: Click Today to navigate back to today's date on the Gantt chart.
See Also
If you would like to learn more about Procore's scheduling software and how it can help your business, please visit our construction scheduling software product page  .
.