Upload Reports to the Power BI Service
Objective
To upload reports to the Power BI service.
Prerequisites
- For the Procore Owners 2.0 report, you must first Set up the Anticipated Cost Report if you want to view snapshot data.
- For the Procore Financials Budget 2.0 report, advanced forecasting uses the default Procore Standard Forecast View.
- The Procore Standard Forecast view is only required if you want to view forecast data within your report.
- For the Procore Financials Budget (Custom) 2.0 report, you will need to do the following:
- To see budget data, you are required to Add Custom Views within the company level Procore Analytics tool under the Budgeting and Forecasting section.
- Additional configuration is also needed for this view, see Configure a Custom Budget Report.
- To see forecasting data, you are required to Add Custom Views within the company level Procore Analytics tool under the Budgeting and Forecasting section.
- To see budget data, you are required to Add Custom Views within the company level Procore Analytics tool under the Budgeting and Forecasting section.
- For the Procore Risk 2.0 report, you must Configure Custom Fields for the Procore Risk Report.
- For the Procore Adoption 2.0 report, you must Configure the Procore Adoptions Report.
Steps
- Navigate to Analytics from your Company Tools menu.
- Go to the Getting Started section.
- Under Power BI Files, select and download the available Power BI reports.
- Log in to the Power BI service using your Power BI login credentials.
- Create a workspace where you want to store your company's Analytics reports. See Microsoft's Power BI support documentation for more information.
Notes: Licensing requirements may apply. - In the workspace, click Upload.
- Now click Browse.
- Select the report file from its location on your computer and click Open.
- After uploading the file, click Filter and select Semantic Model.
- Hover your cursor over the row with the report's name and click the vertical ellipsis
 icon.
icon. - Click Settings.
- On the settings page, click Data source credentials and then click Edit Credentials.
- In the 'Configure [Report Name]' window that appears, complete the following:
- Authentication Method: Select 'Key'.
- Account Key: Enter the token you received from the token generation page in Procore.
- Privacy level setting for this data source: Select the privacy level. We recommend selecting 'Private' or 'Organizational'. See Microsoft's Power BI support documentation for more information about the privacy levels.
- Click Sign in.
- Click Refresh and do the following:
- Time zone: Select the time zone you want to use for scheduled data refreshes.
- Under Configure a refresh schedule, turn the toggle to the ON position.
- Refresh frequency: Select 'Daily'.
- Time: Click Add another time and select 7:00 a.m.
Note: You may add up to 8 refresh times. - Optional:
- Mark the 'Send refresh failure notifications to the dataset owner' checkbox to send refresh failure notifications.
- Enter the email addresses of any other colleagues you want the system to send refresh failure notifications to.
- Click Apply.
- To verify that the settings were configured correctly and that the report's data will refresh properly, return to the 'Filter and select Semantic Model' page and complete the following steps:
- Hover your cursor over the row with the report's name and click the circular arrow icon to refresh the data manually.
- Check the 'Refreshed' column to see if there is a warning
 icon.
icon.
- If no warning icon displays, the report's data is successfully refreshed.
- If a warning icon displays, an error has occurred. Click the warning icon to see more information about the error.
- To delete the blank dashboard the Power BI service created automatically, complete the following steps:
- Hover your cursor over the row with the dashboard's name. Click the ellipsis
 icon and click Delete.
- Hover your cursor over the row with the dashboard's name. Click the ellipsis
- To verify that the report renders properly, navigate to the 'All' or 'Content' page and click on the report's name to view the report in the Power BI service.
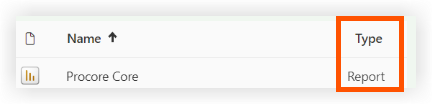
Tip
Reference the 'Type' column to ensure you click on the report instead of a different asset.
- Repeat the steps above within Power BI for each Analytics report file.