Budget Risk
Summary
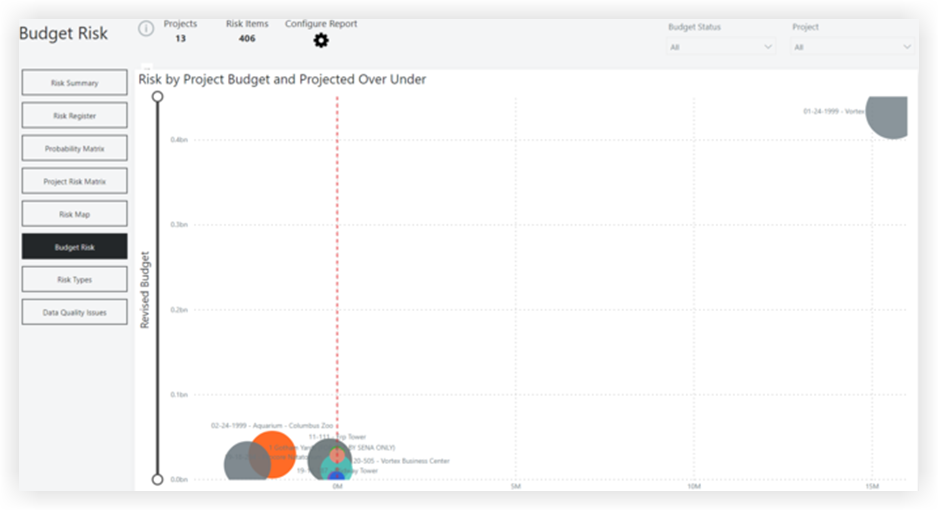
This page uses a scatterplot with the Projected Over/Under on the X-axis and the 'Revised Budget' on the Y-axis. The size of the bubble indicates the risk count.
Sample Report Page
This sample report page was created using mock data for demonstration purposes only.