Risk Report
Table of Contents
Overview
Risk Summary
Summary
This page pulls risk related data from across Procore tools. The risk items and related statuses on each page are driven by the configuration of the report.
Sample Report Page

This sample report page was created using mock data for demonstration purposes only.
Risk Register
Summary
This page is the consolidated register of risks across tools. It should be used to identify and remediate risks.
Sample Report Page
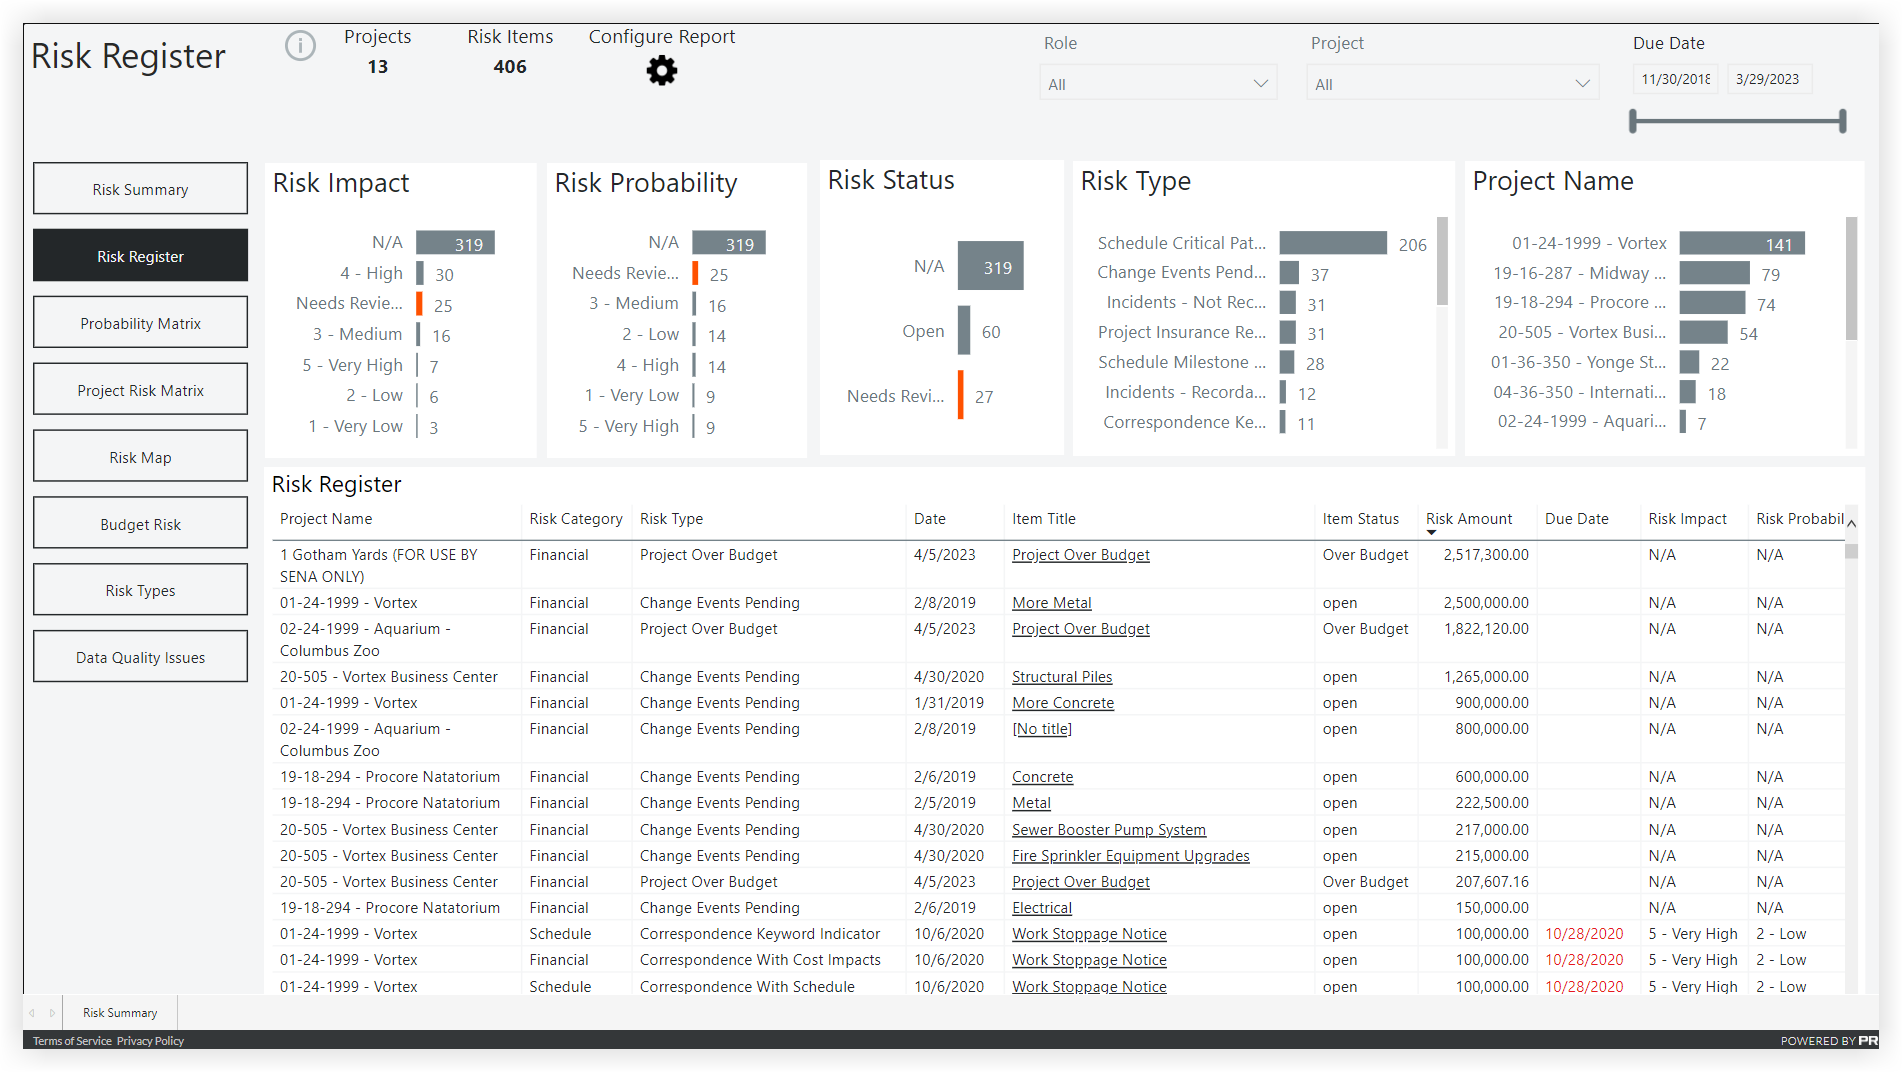
This sample report page was created using mock data for demonstration purposes only.
Probability Matrix
Summary
This page provides a matrix view of data based on the "Risk Impact" and "Risk Probability" custom fields being designated on risk items.
Sample Report Page
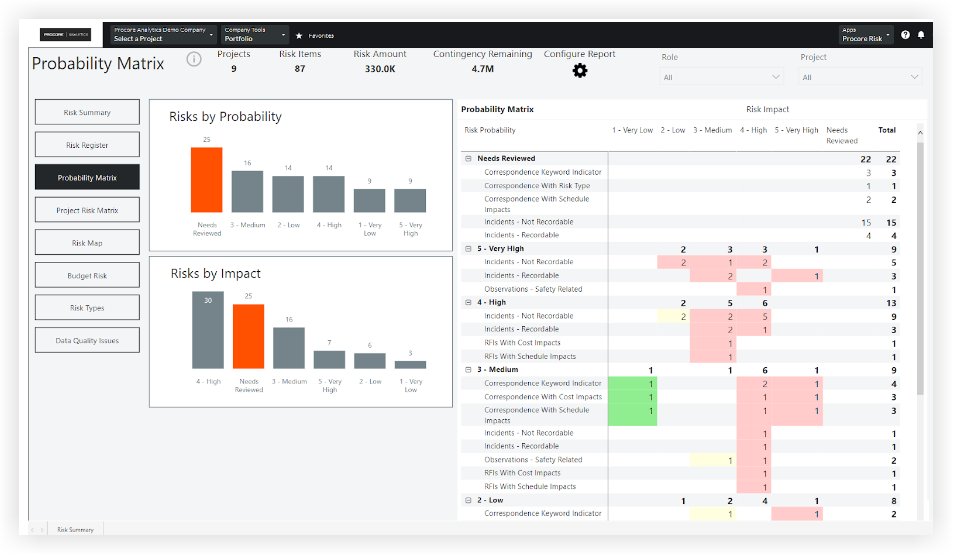
This sample report page was created using mock data for demonstration purposes only.
Project Risk Matrix
Summary
This page lists all projects and shares some key details on risk and budget. The "Risk Score" multiples the weighted values of the "Risk Impact" by the "Risk Probability". The "Risk Balance" takes the "Remaining Contingency" and subtracts the "Risk Amount".
Sample Report Page
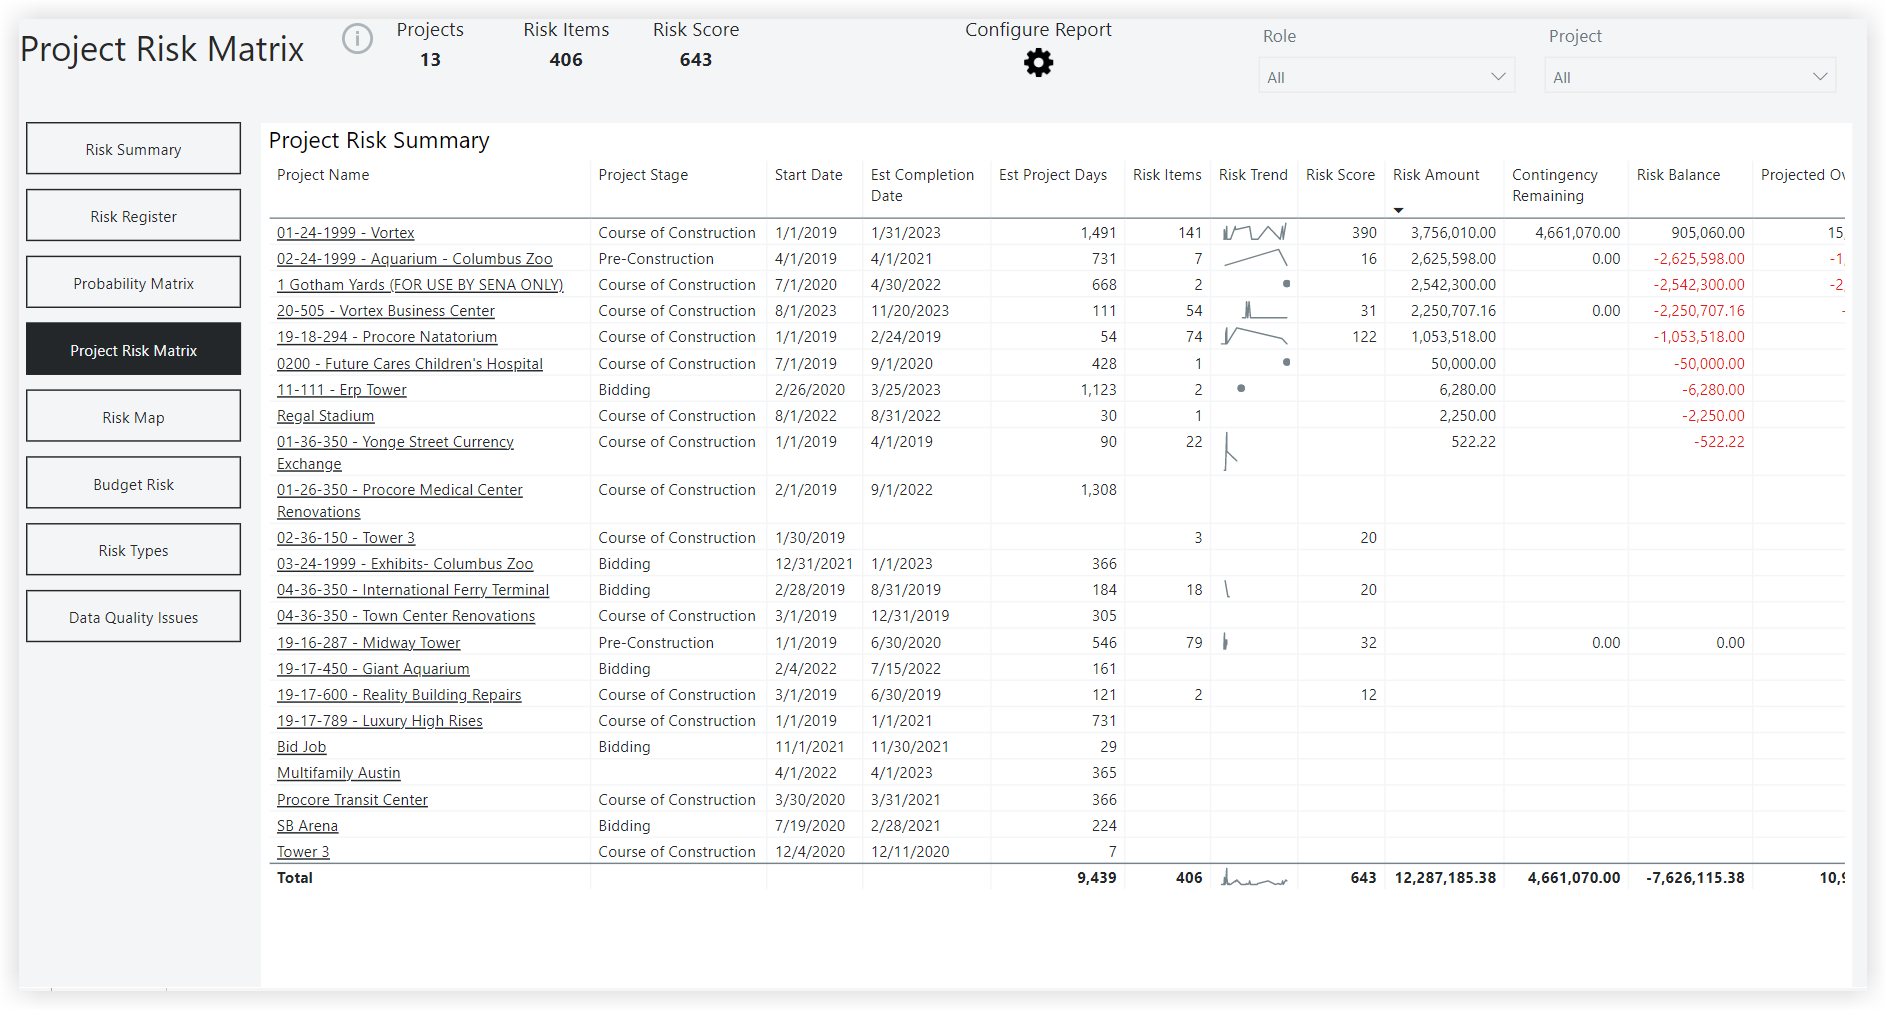
This sample report page was created using mock data for demonstration purposes only.
Risk Map
Summary
This page shows the risk of a given project. The size of the bubble indicates a higher risk count.
Sample Report Page
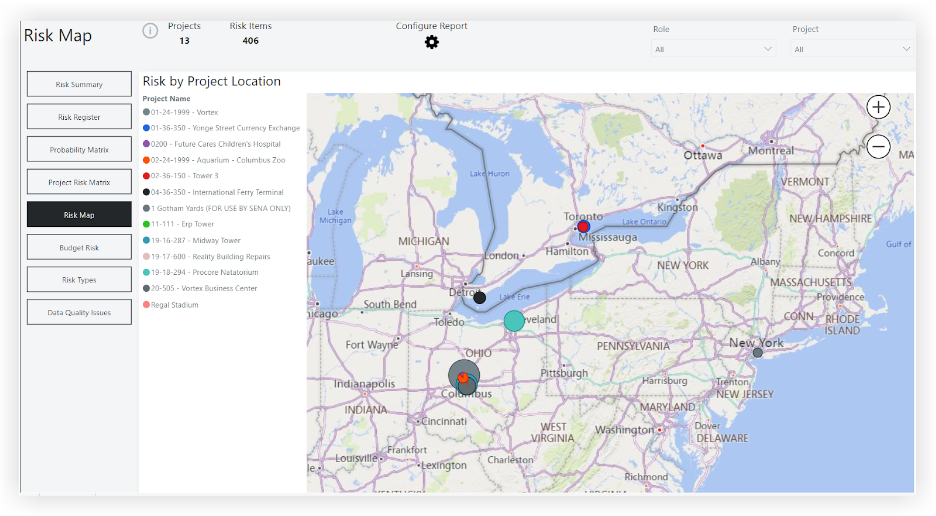
This sample report page was created using mock data for demonstration purposes only.
Budget Risk
Summary
This page uses a scatterplot with the Projected Over/Under on the X-axis and the 'Revised Budget' on the Y-axis. The size of the bubble indicates the risk count.
Sample Report Page
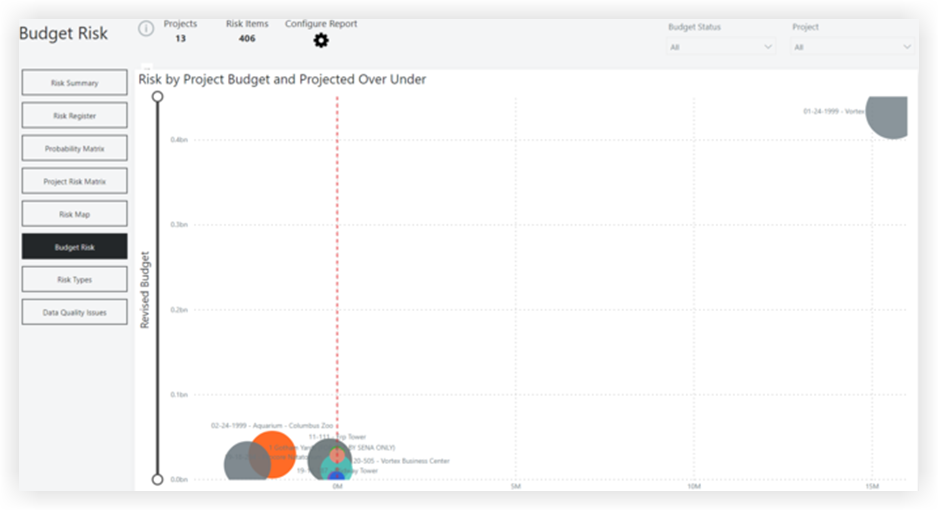
This sample report page was created using mock data for demonstration purposes only.
Risk Types
Summary
This page summarizes all available risk types, provides a description, and some other key details related to each item.
Sample Report Page
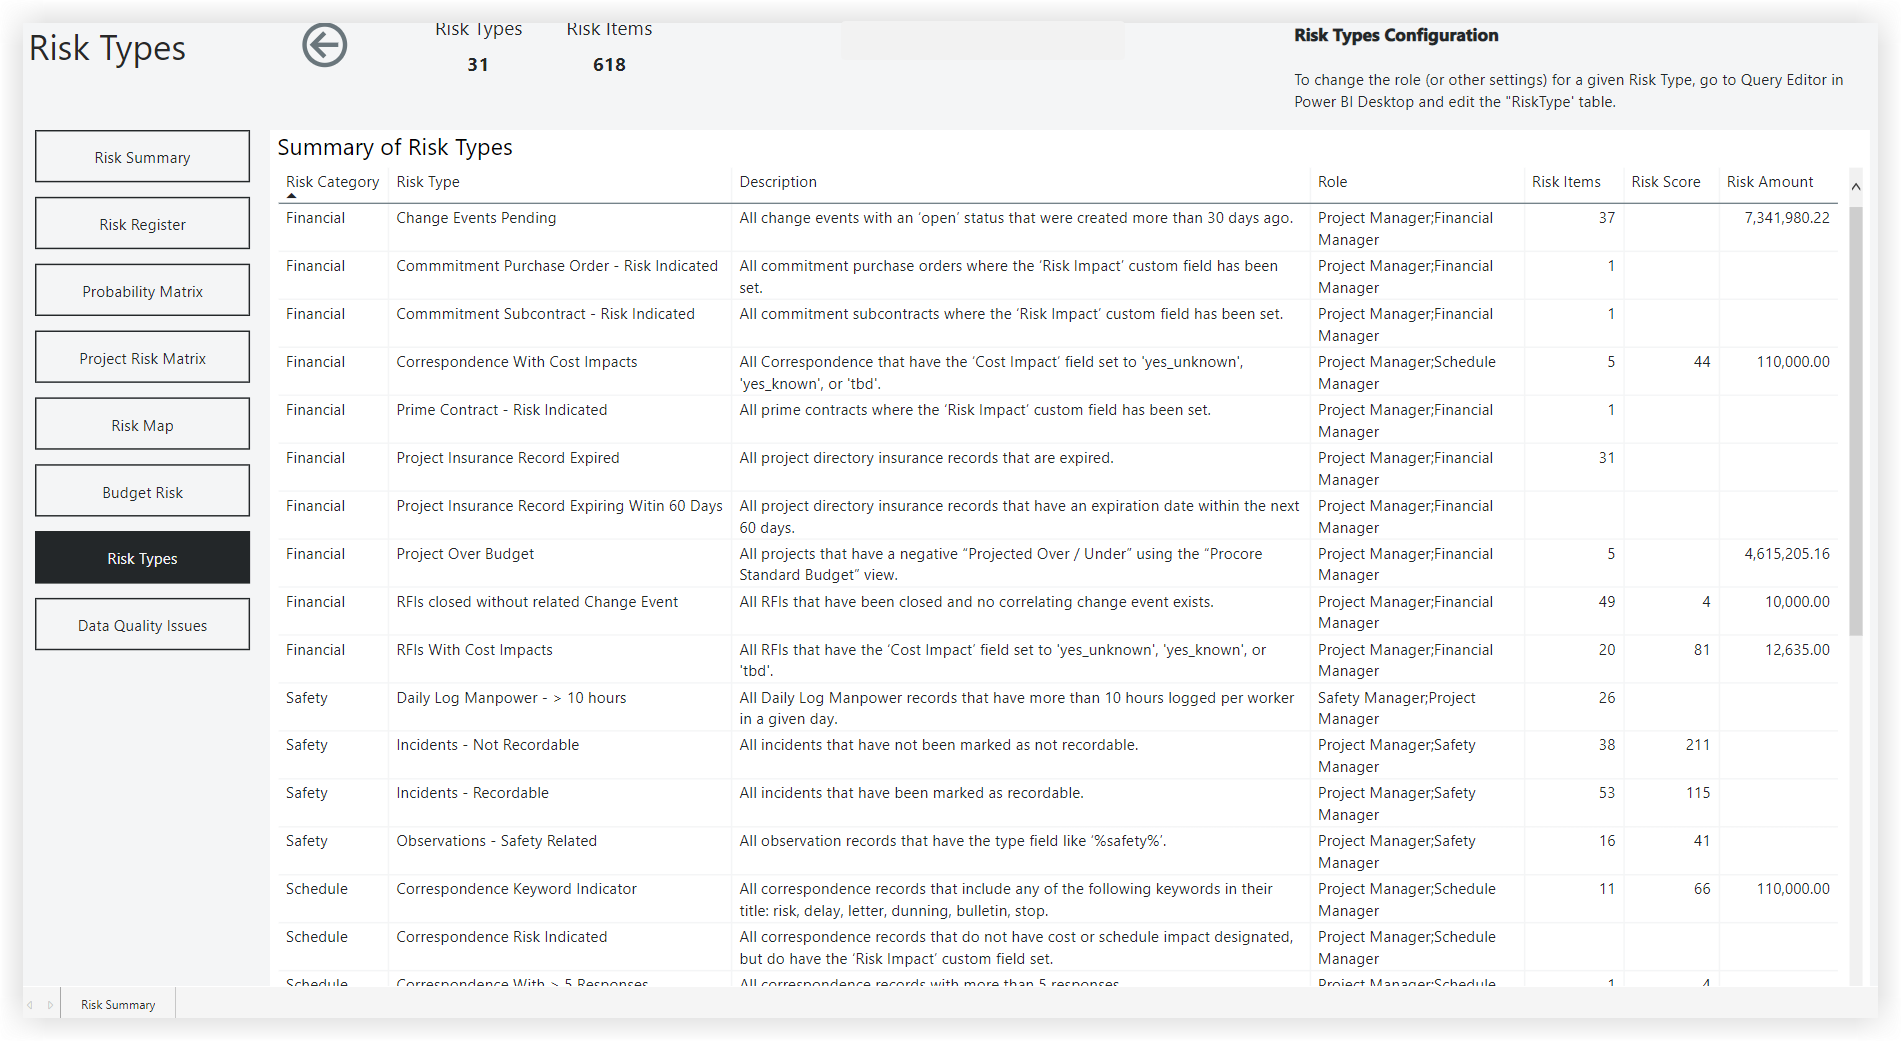
This sample report page was created using mock data for demonstration purposes only.
Data Quality Issues
Summary
This page is focused on identifying data quality issues that should be addressed.
Sample Report Page
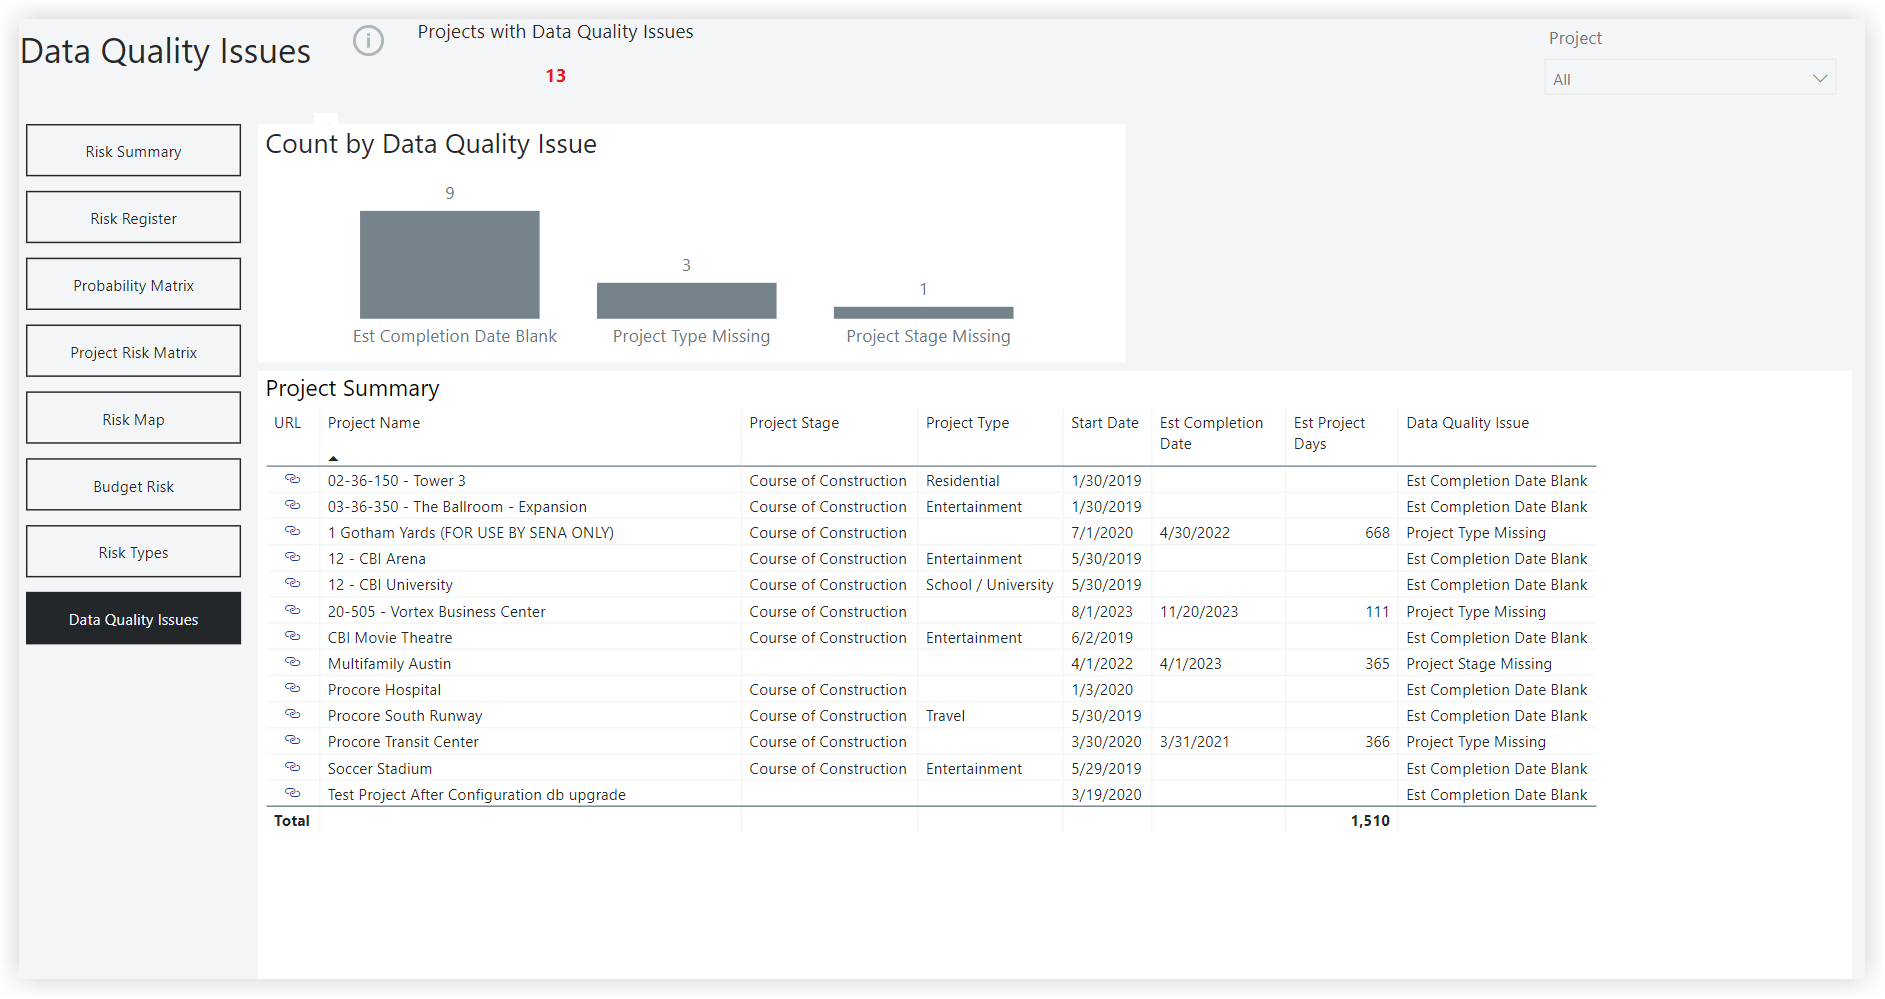
This sample report page was created using mock data for demonstration purposes only.
Configuration
Summary
This page allows users to change the default settings for the report. These include settings for Risk Types, Risk Impacts, Risk Probability, Risk Statuses, and Item Statuses.
Sample Report Page
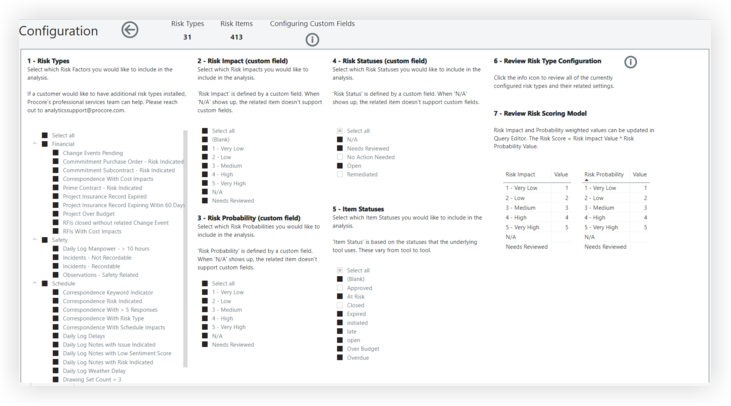
This sample report page was created using mock data for demonstration purposes only.