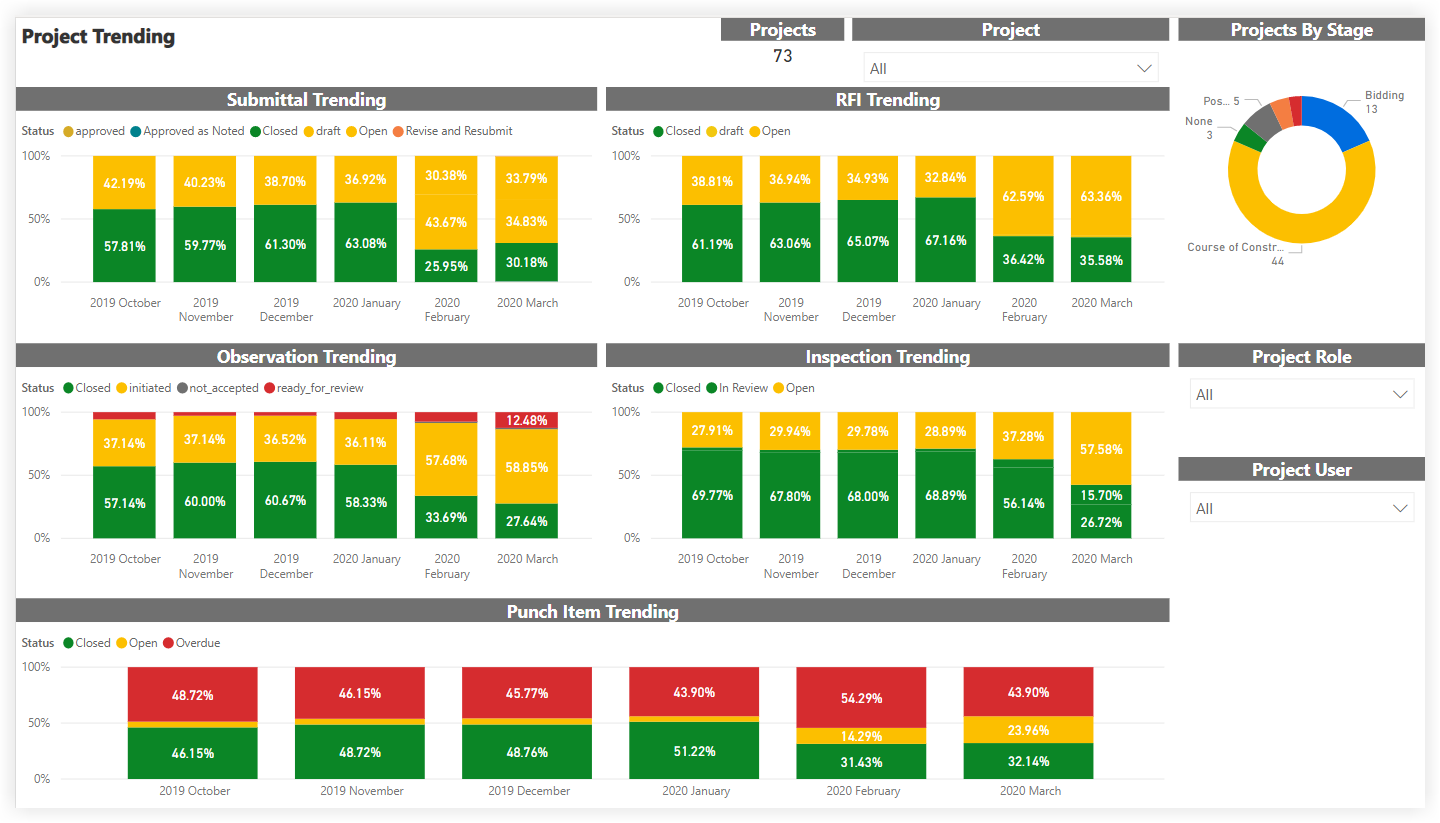
Project Trending
Summary
The Project Trending page is part of the Analytics Project Management Report. The scope for the data is set by the selection in the Project drop-down list. Your Procore user account must be added to the appropriate Project level Directory in order to see a project's data reflected in this page. By applying the Project filter, you can expand the scope for an overview of all projects or narrow the data in view to a specific project. It also shows a donut chart summary of your company's Projects By Stage, with a count of the project(s) in each stage of construction.
- The trending areas shows bar charts for trending Procore items. These charts provide percentage summaries of your company's submittals, RFIs, observations, inspections, and punch list items for the past six (6) months.
- Each item's stacked bar chart is color-coded by status for easier reading. Data for this page is derived from weekly snapshots of Procore's item counts.
Sample Report Page

This sample report page was created using mock data for demonstration purposes only.

