Key Influencers
Summary
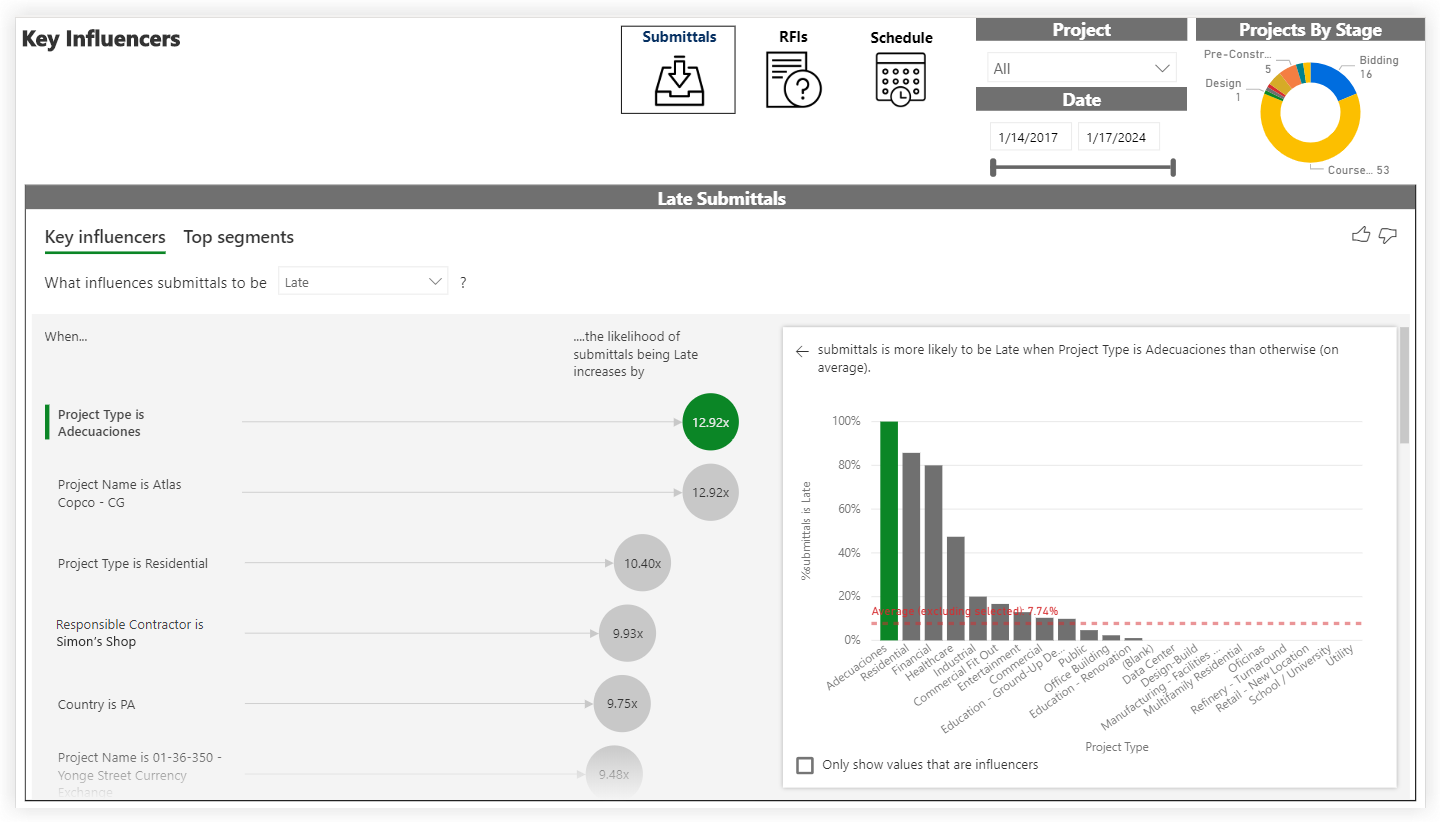
The Key Influencers page is part of the Analytics Project Management Report. This page analyzes data from various Procore tools to show the likelihood of a specific item (Submittals, RFIs, or Schedule) to end up being late on a project. Using the Project and Date controls, you can include all available data or narrow the report to look at a specific project or date range.
- The Projects By Stage donut chart shows the number of projects included the report's scope by stage of construction.
- The main area of the Key Influencers report (for example, the 'Late Submittals' area shown below) includes these tabs: Key Influencers and Top Segments.
- The Key Influencers tab lets you select a metric to investigate from the drop-down list. The selected value is Late.
- The visual on the left contains a visual that summarizes the factors that contribute to the likelihood of an item being late, along with a calculated estimate (for example, in the illustration below, a submittal on a Residential project is 10.40x more likely to be late than a Public project.
- The bar chart on the right displays all of the values contributing to the result showing on the Key Influencers tab for the selected item. It also shows the threshold at which potential values are shown on the Key Influencers chart.
Sample Report Page
This sample report page was created using mock data for demonstration purposes only.