Create a Change Events Scope, Type, and Reason Report
Objective
To create a report and visual for your project's change events scope, type, and reason.
Background
Use the Project 360 Reporting tool to analyze the financial impact of your project's change events. To do this, create a report and pie charts that break down the total cost of changes by their scope, type, and reason. Visualizing this data helps you quickly identify the primary drivers of cost changes on your project.
Things to Consider
- Required User Permissions:
- 'Admin' level permissions on the Project 360 Reporting tool.
Steps
- Navigate to the Project 360 Reporting tool.
- Click + Create Report.
- Click Single Tool Report.
- Enter a Report name (e.g. Change Events).
- Enter a description (optional).
- Select the tool Change Events.
- Click Next Step.
- Change the name of the first tab to "Scope."
- Click the +Add Tab button and name it "Type."
- Click the + Add Tab button and name it "Reason."
- For each tab, select the corresponding column value (i.e. Scope, Type, or Reason) and the ROM Total Amount.
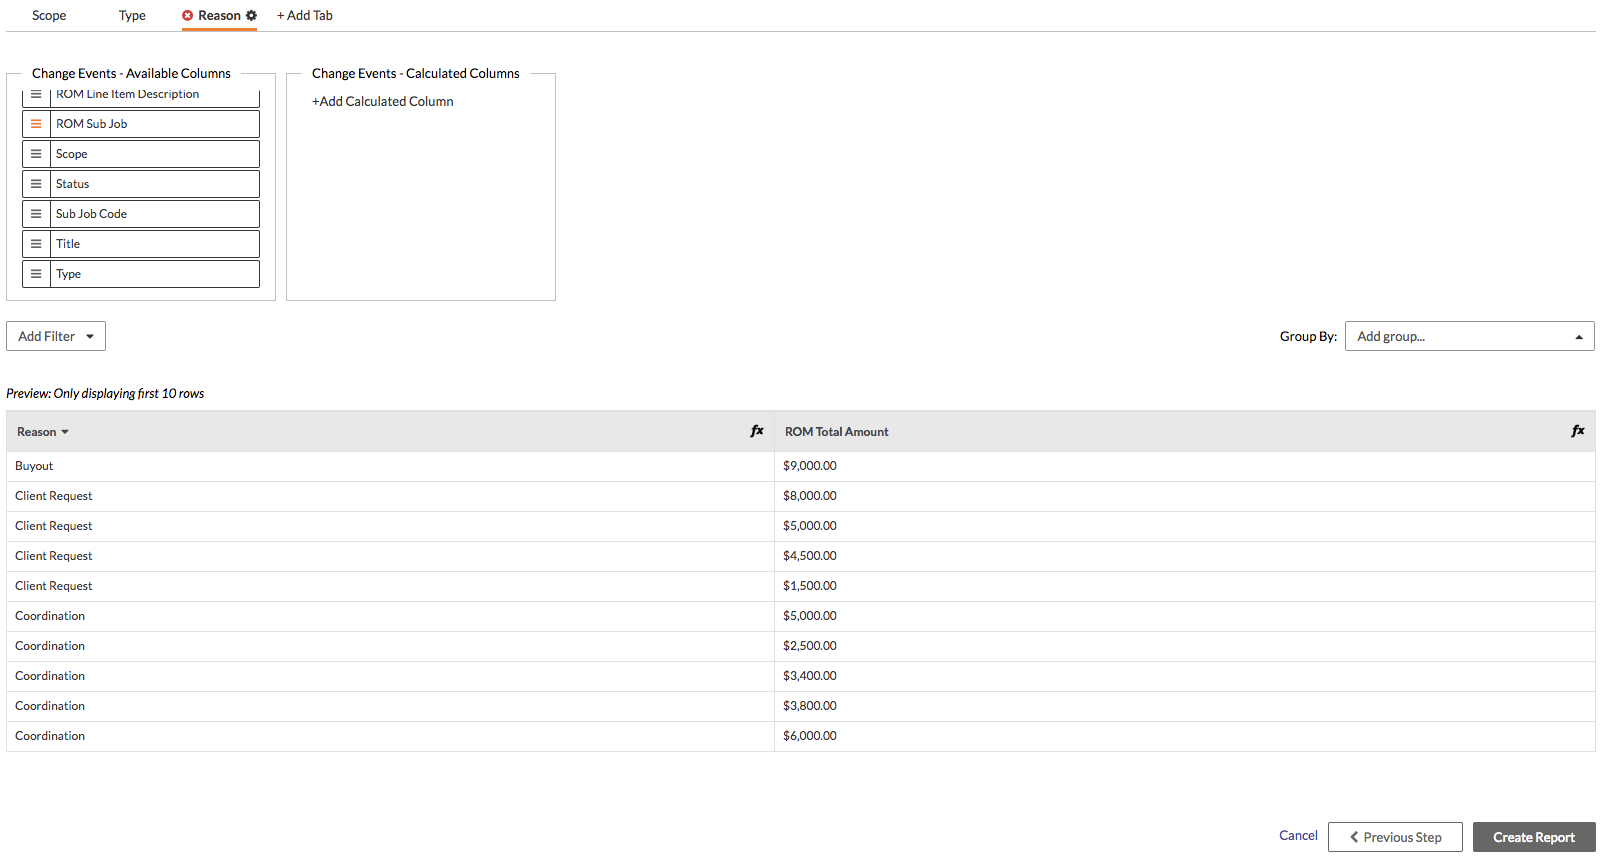
- Click Create Report.
Create Visual
For each tab, complete the following steps:
- Click the + Add Visual button.
- Enter in the following information:
- Title: Enter a title for the visual.
- Column: Select Scope, Type, or Reason.
- Measure: Select ROM Total Amount.
- Select the Pie chart option.
- Click Save.
