View the Punch List Dashboard
| Back to Deficiency List | Current Lesson - 1/27 | Next |
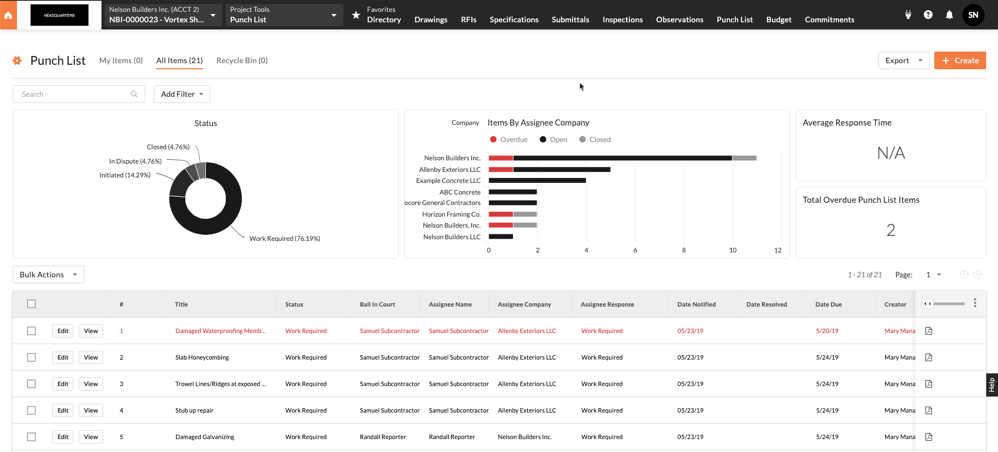
The Deficiency List dashboard provides you with an interactive collection of visual graphs and charts to help you locate a project's deficiency list items so you can quickly take action on them.
- Navigate to the project's Deficiency List tool.
- Click My Items or All Items to view the corresponding dashboard.
- Status. An interactive chart displaying the distribution of punch items by their workflow status.
- Items by Company. An interactive chart displaying all assignee companies with punch items by status of Open, Closed, or Overdue.
- Average Response Time. Displays the average response time of assignees for punch items by calculating the average number of days it takes a punch item to go from 'Work Required' to 'Ready to Review'.
- Total Overdue Punch List Items. Displays the total number of punch list items currently Overdue.

- Interact with the dashboard as follows:
- View details about the data by hovering the mouse cursor over a chart element.
OR - Click a chart element to narrow the data in view by the selected item.
- View details about the data by hovering the mouse cursor over a chart element.
- (Optional) Apply filters to the dataset as follows:
- Click Add Filter and select an option from the drop-down list. The filters you can apply include:
- Assignee
- Assignee Company
- Assignee Response
- Ball In Court
- Closed By
- Creator
- Date Closed
- Date Created
- Date Due
- Date Notified
- Final Approver
- Location
- Priority
- Punch Item Manager
- Status
- Trade
- Type
- Apply a secondary filter by selecting the desired checkboxes in the drop-down list.
- Click Clear All to remove any filters that have been applied to the dataset.
- Click Add Filter and select an option from the drop-down list. The filters you can apply include:

