Create a Custom Report for Action Plans
Objective
To create a custom report with data from the project's Action Plans tool.
Things to Consider
- Required User Permissions:
- To create a custom report with action plans data in the Company level Reports tool:
- 'Read Only' level permissions or higher on the project's Action Plans tool.
AND - 'Standard' level permissions or higher on the Company level Reports tool.
- 'Read Only' level permissions or higher on the project's Action Plans tool.
- To create a custom report with action plans data in the Project level Reports tool:
- 'Read Only' level permissions or higher on the project's Action Plans tool.
AND - 'Standard' level permissions or higher on the Project level Reports tool.
- 'Read Only' level permissions or higher on the project's Action Plans tool.
- To create a custom report with action plans data in the Company level Reports tool:
Steps
- Navigate to the Company level Reports tool.
OR
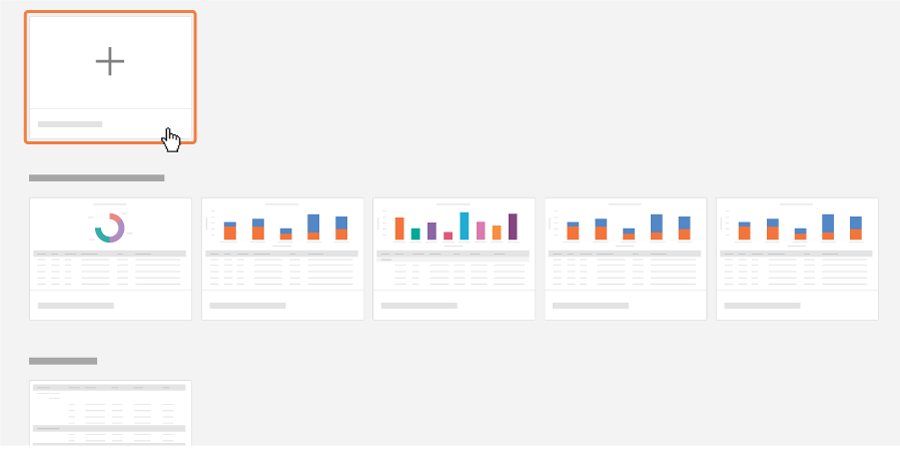
Navigate to the Project level Reports tool. - Click Create Report.
- Click Create New Report.
- Add a name and description for your new report as follows:
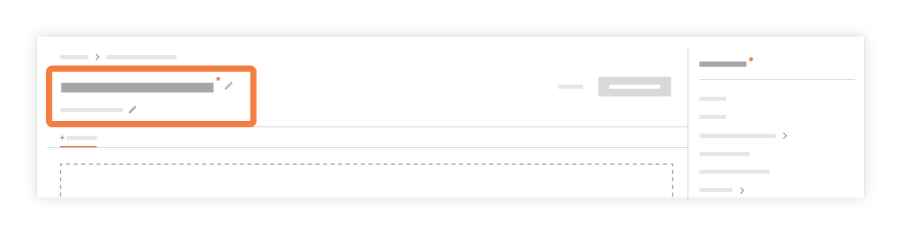
- Enter Report Name. Click the
 icon and then type a name for your report in this field.
 - Enter Description. Click the icon and then type a descriptive statement for your report in this field.
- Enter Report Name. Click the
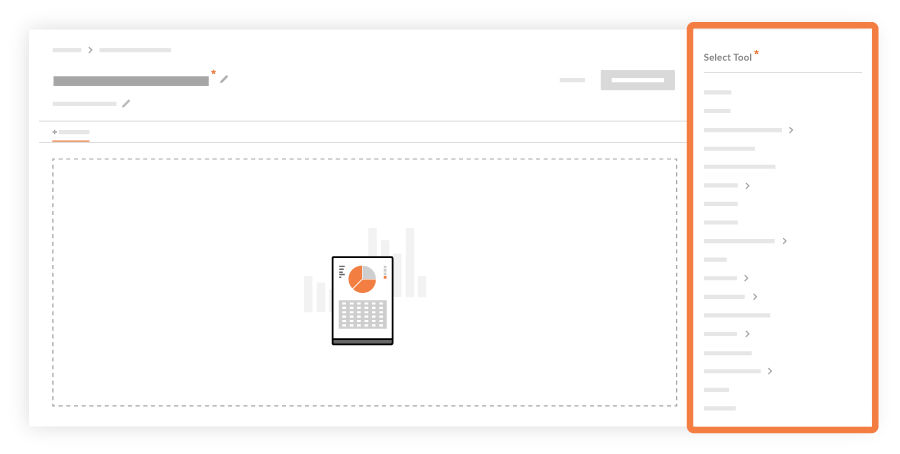
- In the 'Select Tool' menu, click Action Plans.
- Click Add Tab and select a Procore project tool for the new report tab's source data:
Note: By default, Procore uses 'Action Plans' as the name the tab.
- Optional: To rename the tab, do the following:
- Click gray gear icon next to the tab name.
- In the Edit Tab window, type a new Title for the selected tab.
- Click Update.
- Add columns to your report as follows:
- To add a column, use a drag-and-drop operation to move a column from the right pane into the body of your report.
OR - To add all of the available columns, click Add All.
OR - To change the position of a column, use a drag-and-drop operation to move the column to the desired position in the report table.
OR - To remove all of the columns from your report, click Remove All.
- To add a column, use a drag-and-drop operation to move a column from the right pane into the body of your report.
- Once you've added the desired columns, you have these options:
- Aggregate data
Click fx in the column heading and select one of the following (for numeric values): count, sum, min, max, or average.
Notes:- Once the report is created, you will see the count, sum, min, max, or average of the values at the bottom of the column.
- For field types that are not a numeric value, you have the option to aggregate by count.
- Change the column order
Use a drag-and-drop operation to place the column into the desired position. - Filter your report data
Click the Add Filter drop-down menu to select what you would like to filter by. Once you've specified a filter, you can add another filter. You can also filter data by date range by selecting a start and end date. - Group report data
In the Group by list, select one of the items in the drop-down menu to group report data by the specified column (e.g., you may want to group data by the responsible contractor).

- Aggregate data
- Optional: If you want to add additional tools to your report, click Add Tab and select the tool. Then repeat the steps above.
- Click Create Report.