View App Management Metrics in a Project
Objective
To view App Management Metrics for a given App in a project.
Background
As a project user, you can view App Management Metrics for a given App within a project. The data presented are scoped to the current project.
Things to Consider
- Required User Permissions:
- 'Read-only' or higher on the Portfolio tool.
- Data Availability:
- Data connection and embedded App usage metrics will not be immediately available in App Management Metrics, and could take up to 24 hours to appear.
- Applications Not Supported:
- App Management Metrics for the Zoom, Meetings with Microsoft Teams, and Meetings with GoToMeeting integrations are currently not supported.
Steps
- Navigate to the project you want to view App Management Metrics in.
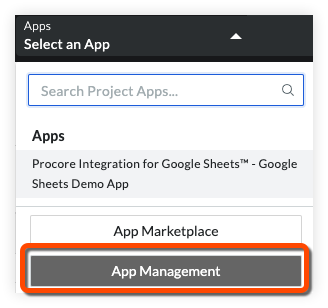
- In the top navigation bar, open the Apps dropdown menu and click App Management.
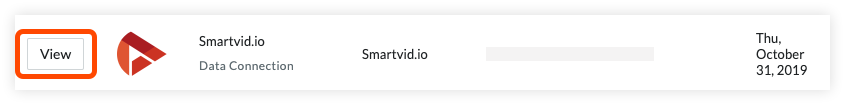
- Locate the App you want to view App Management Metrics for and click its View button.
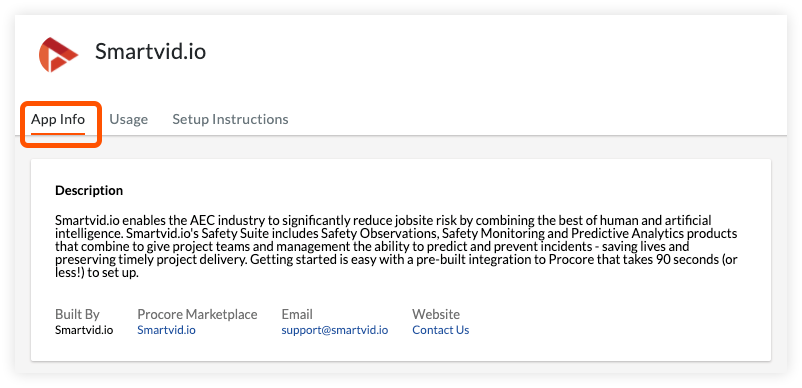
- Click the 'App Info' tab. General information about the App is presented on the App Info tab. See View Information about an Installed App for more information.
- Click the 'Usage' tab.
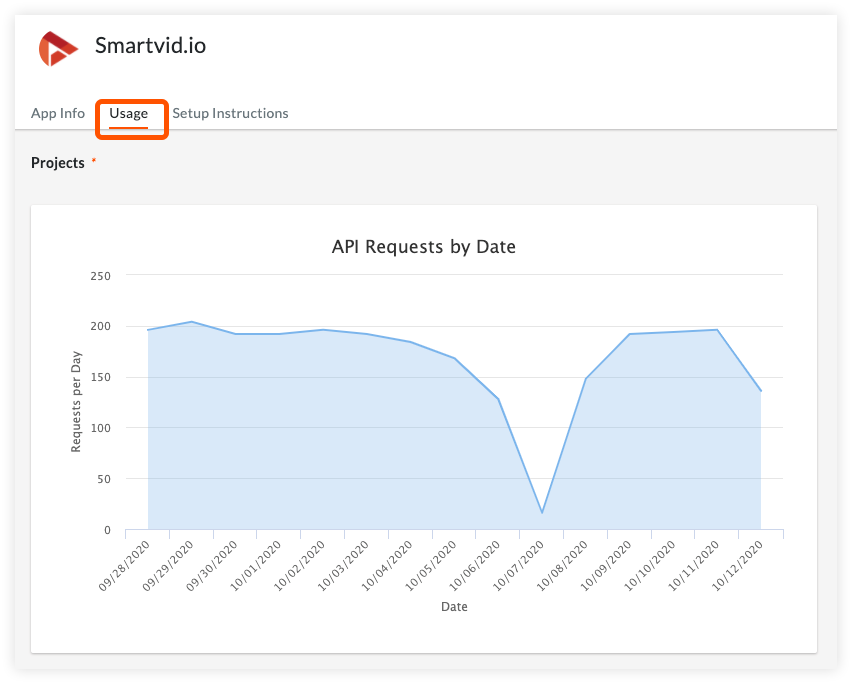
- Daily API request totals for the past two-week period for the selected project are plotted on a graph. [Note: For embedded Apps, these data represent instances of project users launching the App in the Embedded Experience from the Procore user interface.]
Note
- At least two days' worth of data must exist in order for plotted data points to be visible in the graph.
- If no calls to the Procore API have been made by an App (or embedded use) in more than a two-week period, the graph will be empty.