View the Financials Dashboard
Background
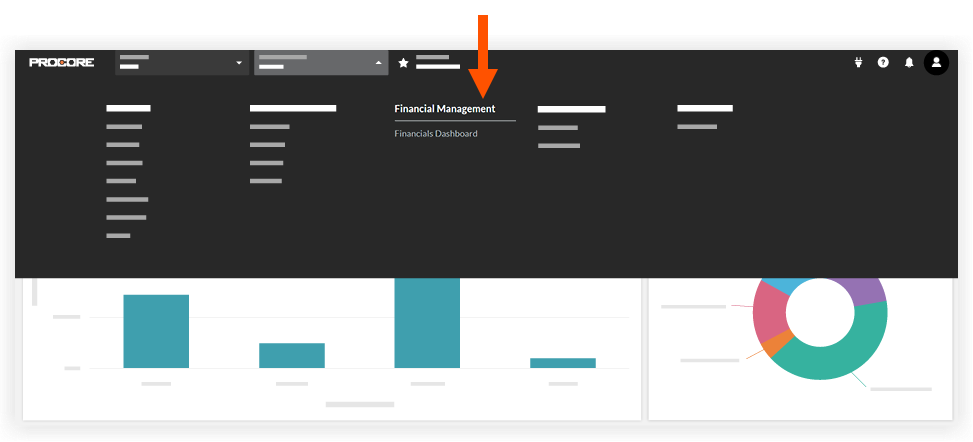
The Financials Dashboard is a collection of charts and graphs available at the Company level that report on various data from project tools in the Financial Management product category.
Things to Consider
- Required User Permissions:
- 'Admin' level permissions for all project tools in the Financial Management product category
- 'Standard' level permissions or higher on the Company level Reports tool
- Additional Information:
- All tools in the Financial Management product category have to be enabled on at least one project.
Note: The Direct Costs tool does not need to be enabled for companies using an ERP integration. - This dashboard cannot be customized and does not include any dashboards that you have created. To create and customize your own dashboards, see Create a Dashboard.
- All tools in the Financial Management product category have to be enabled on at least one project.
Charts and Graphs
Tip
- You can apply one or more filters to narrow the project data used in the charts and graphs.
- You can click on any graph or chart for more details and click on individual assets to quickly navigate to where that asset can be found in Procore.
- Total Amount Approved Commitment Change Orders by Contract Company: This graph displays each contract company across your company's projects and the total amount of approved commitment change orders they have in all projects in your company's account.
- Total Owner Invoice Amount by Project: This graph displays the total owner invoice amounts for each project in your company's account.
- Total Amount Approved Commitment Change Orders by Project: This graph displays the amount of approved commitment change orders for each project in your company's account.
- Direct Cost by Category: This pie chart displays all direct costs across your company's projects and breaks up each direct cost by category/cost type.
- Total Amount Approved Prime Change Orders by Project:This graph displays the amount of approved prime change orders for each project in your company's account.