Root Cause Analysis
Summary
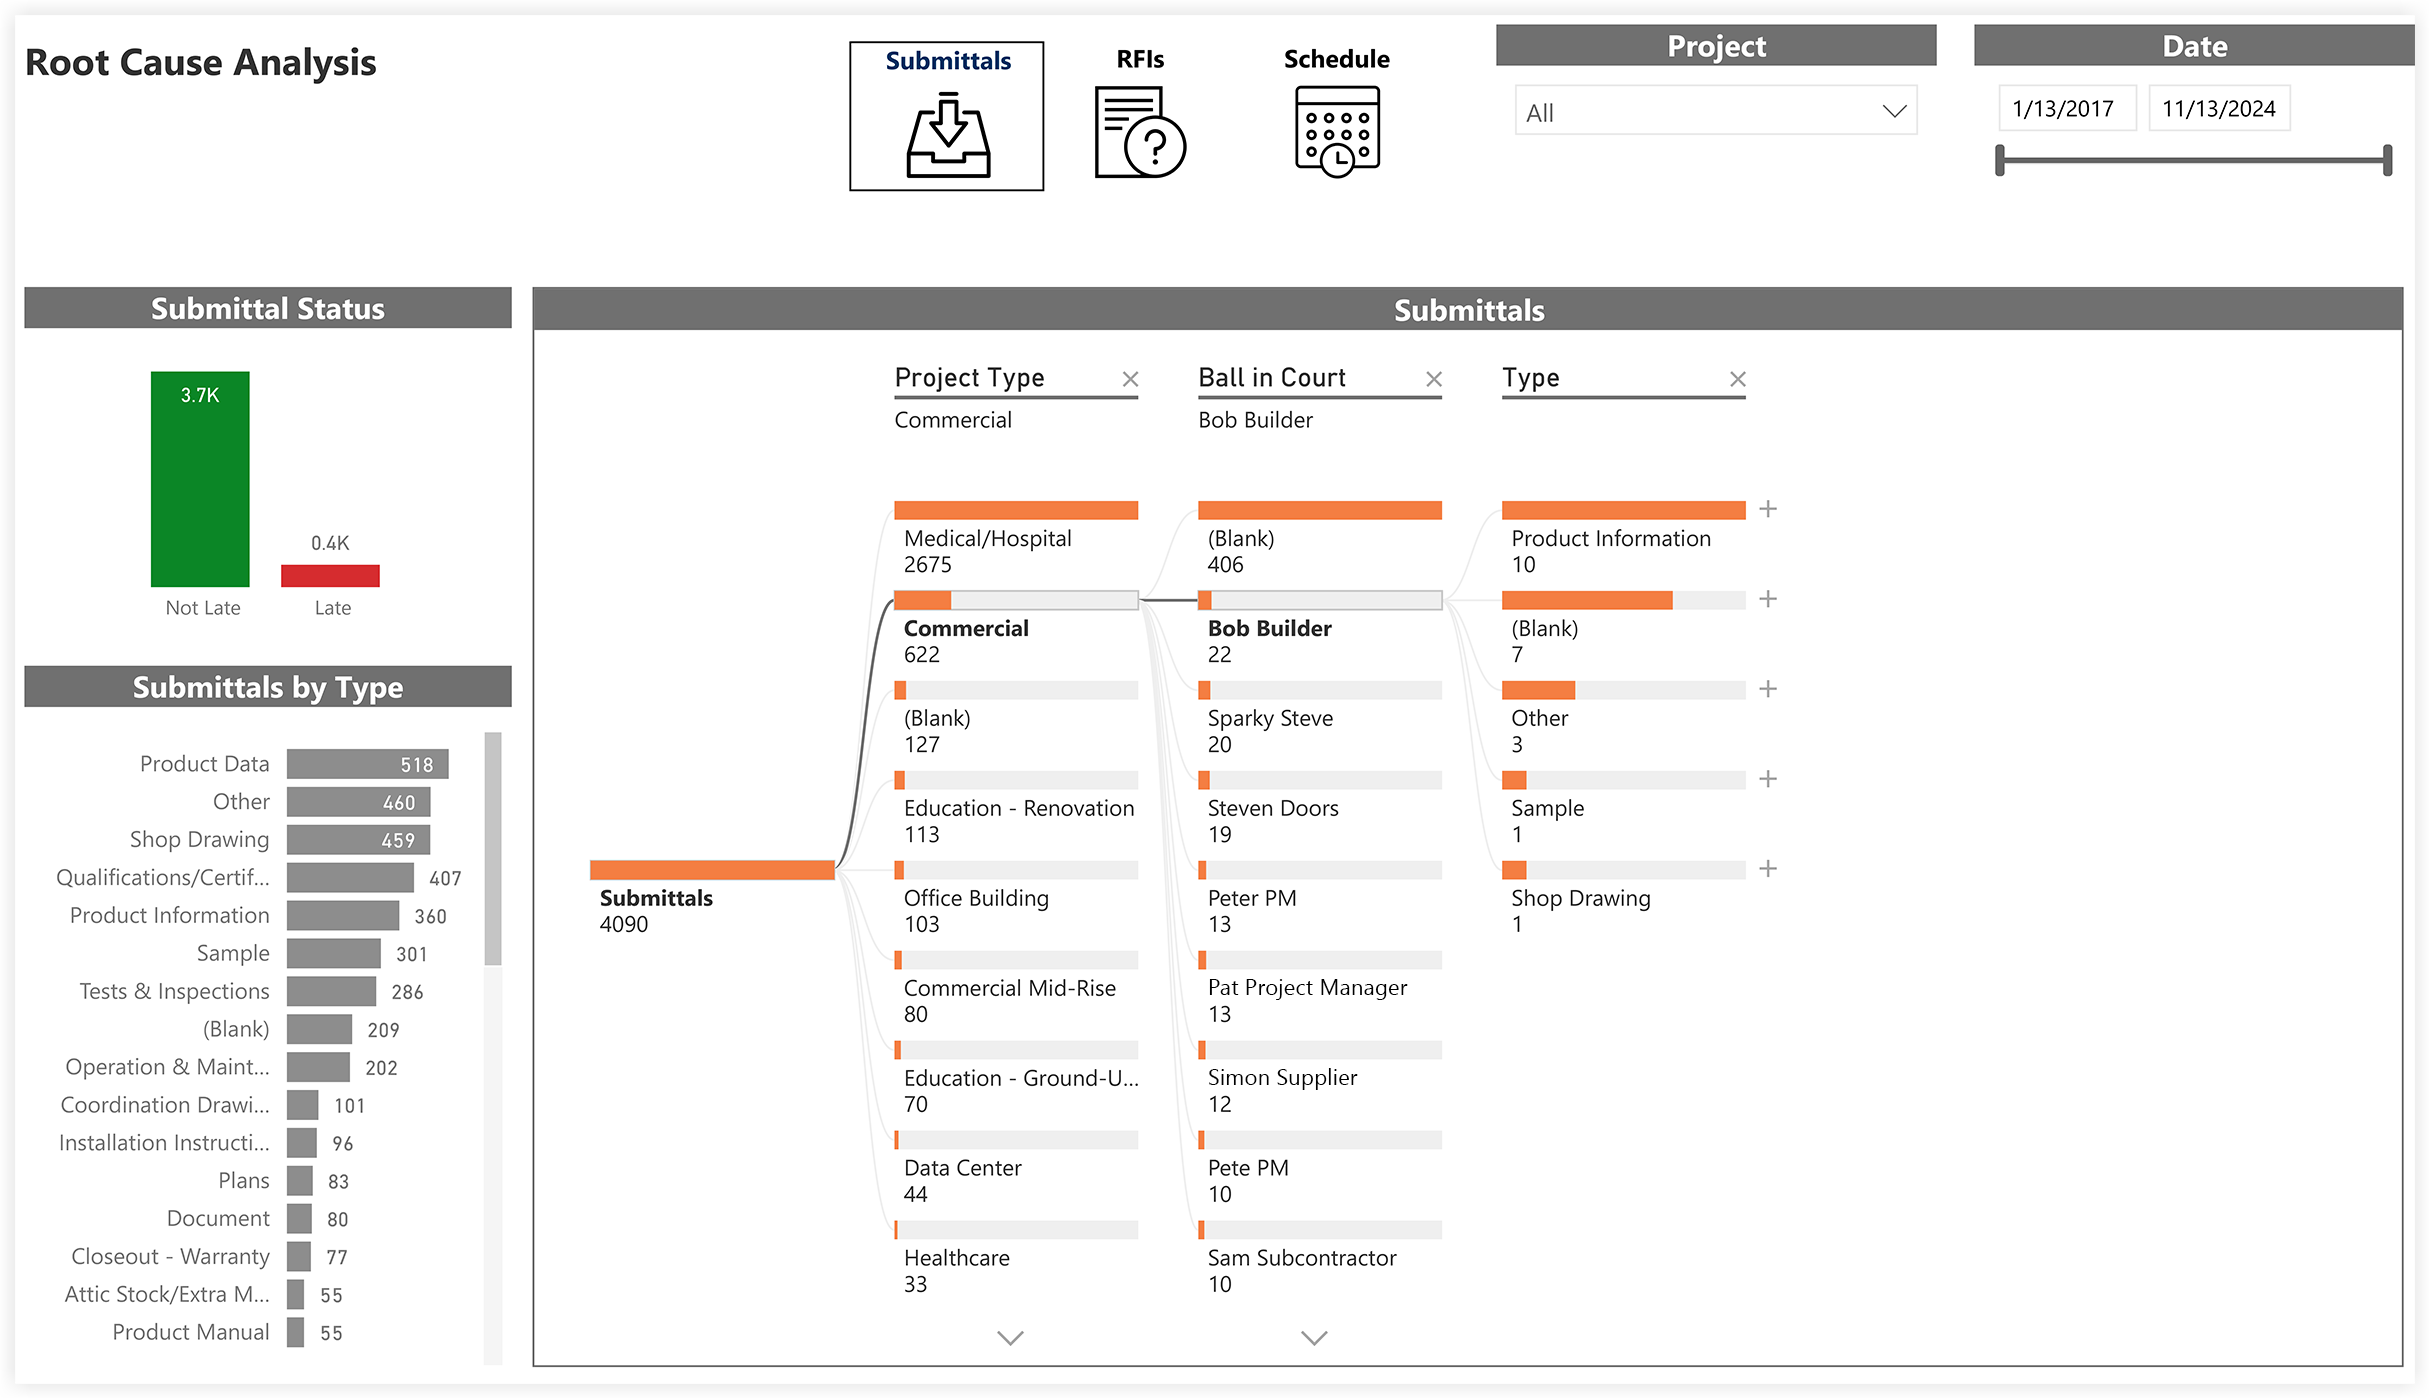
The Root Cause Analysis page is part of the Analytics Project Management report. With this page, you can analyze the item data (for example, Submittals, RFIs, and Schedule) in your company's account by various dimensions. Using the Project and Date controls, you can include all available data or narrow the report to look at a specific project or date range. This report contains these visuals:
- The bar chart on the left shows the total number of items in a bar chart format with a numeric count showing the total number of items in each category.
- The horizontal bar chart on the lower left aggregates items by the available types. In the example below, submittals are categorized by any default and/or custom submittal type. See What are the default submittal types in Procore? and Create Custom Submittal Types.
- The decomposition tree on the right uses Power BI's Artifical Intelligence (AI) to visualize your Procore data and its components so you can quickly perform an ad-hoc analysis by exploring your data across multiple dimensions.
Tip
What can I do with a decomposition tree? To learn more, see this documentation resource on the Microsoft's Power BI site.Sample Report Page
This sample report page was created using mock data for demonstration purposes only.