Adoption Report
Table of Contents
Overview
Leaderboard
Summary
As part of the Procore Analytics Adoption Report, the Leaderboard Report gives you a comprehensive view of which projects are leading the charge in leveraging Procore. You can also see which projects are lagging behind. Analyze your data by project, office, region, user, and many more fields to gain further insights.
Sample Report Page
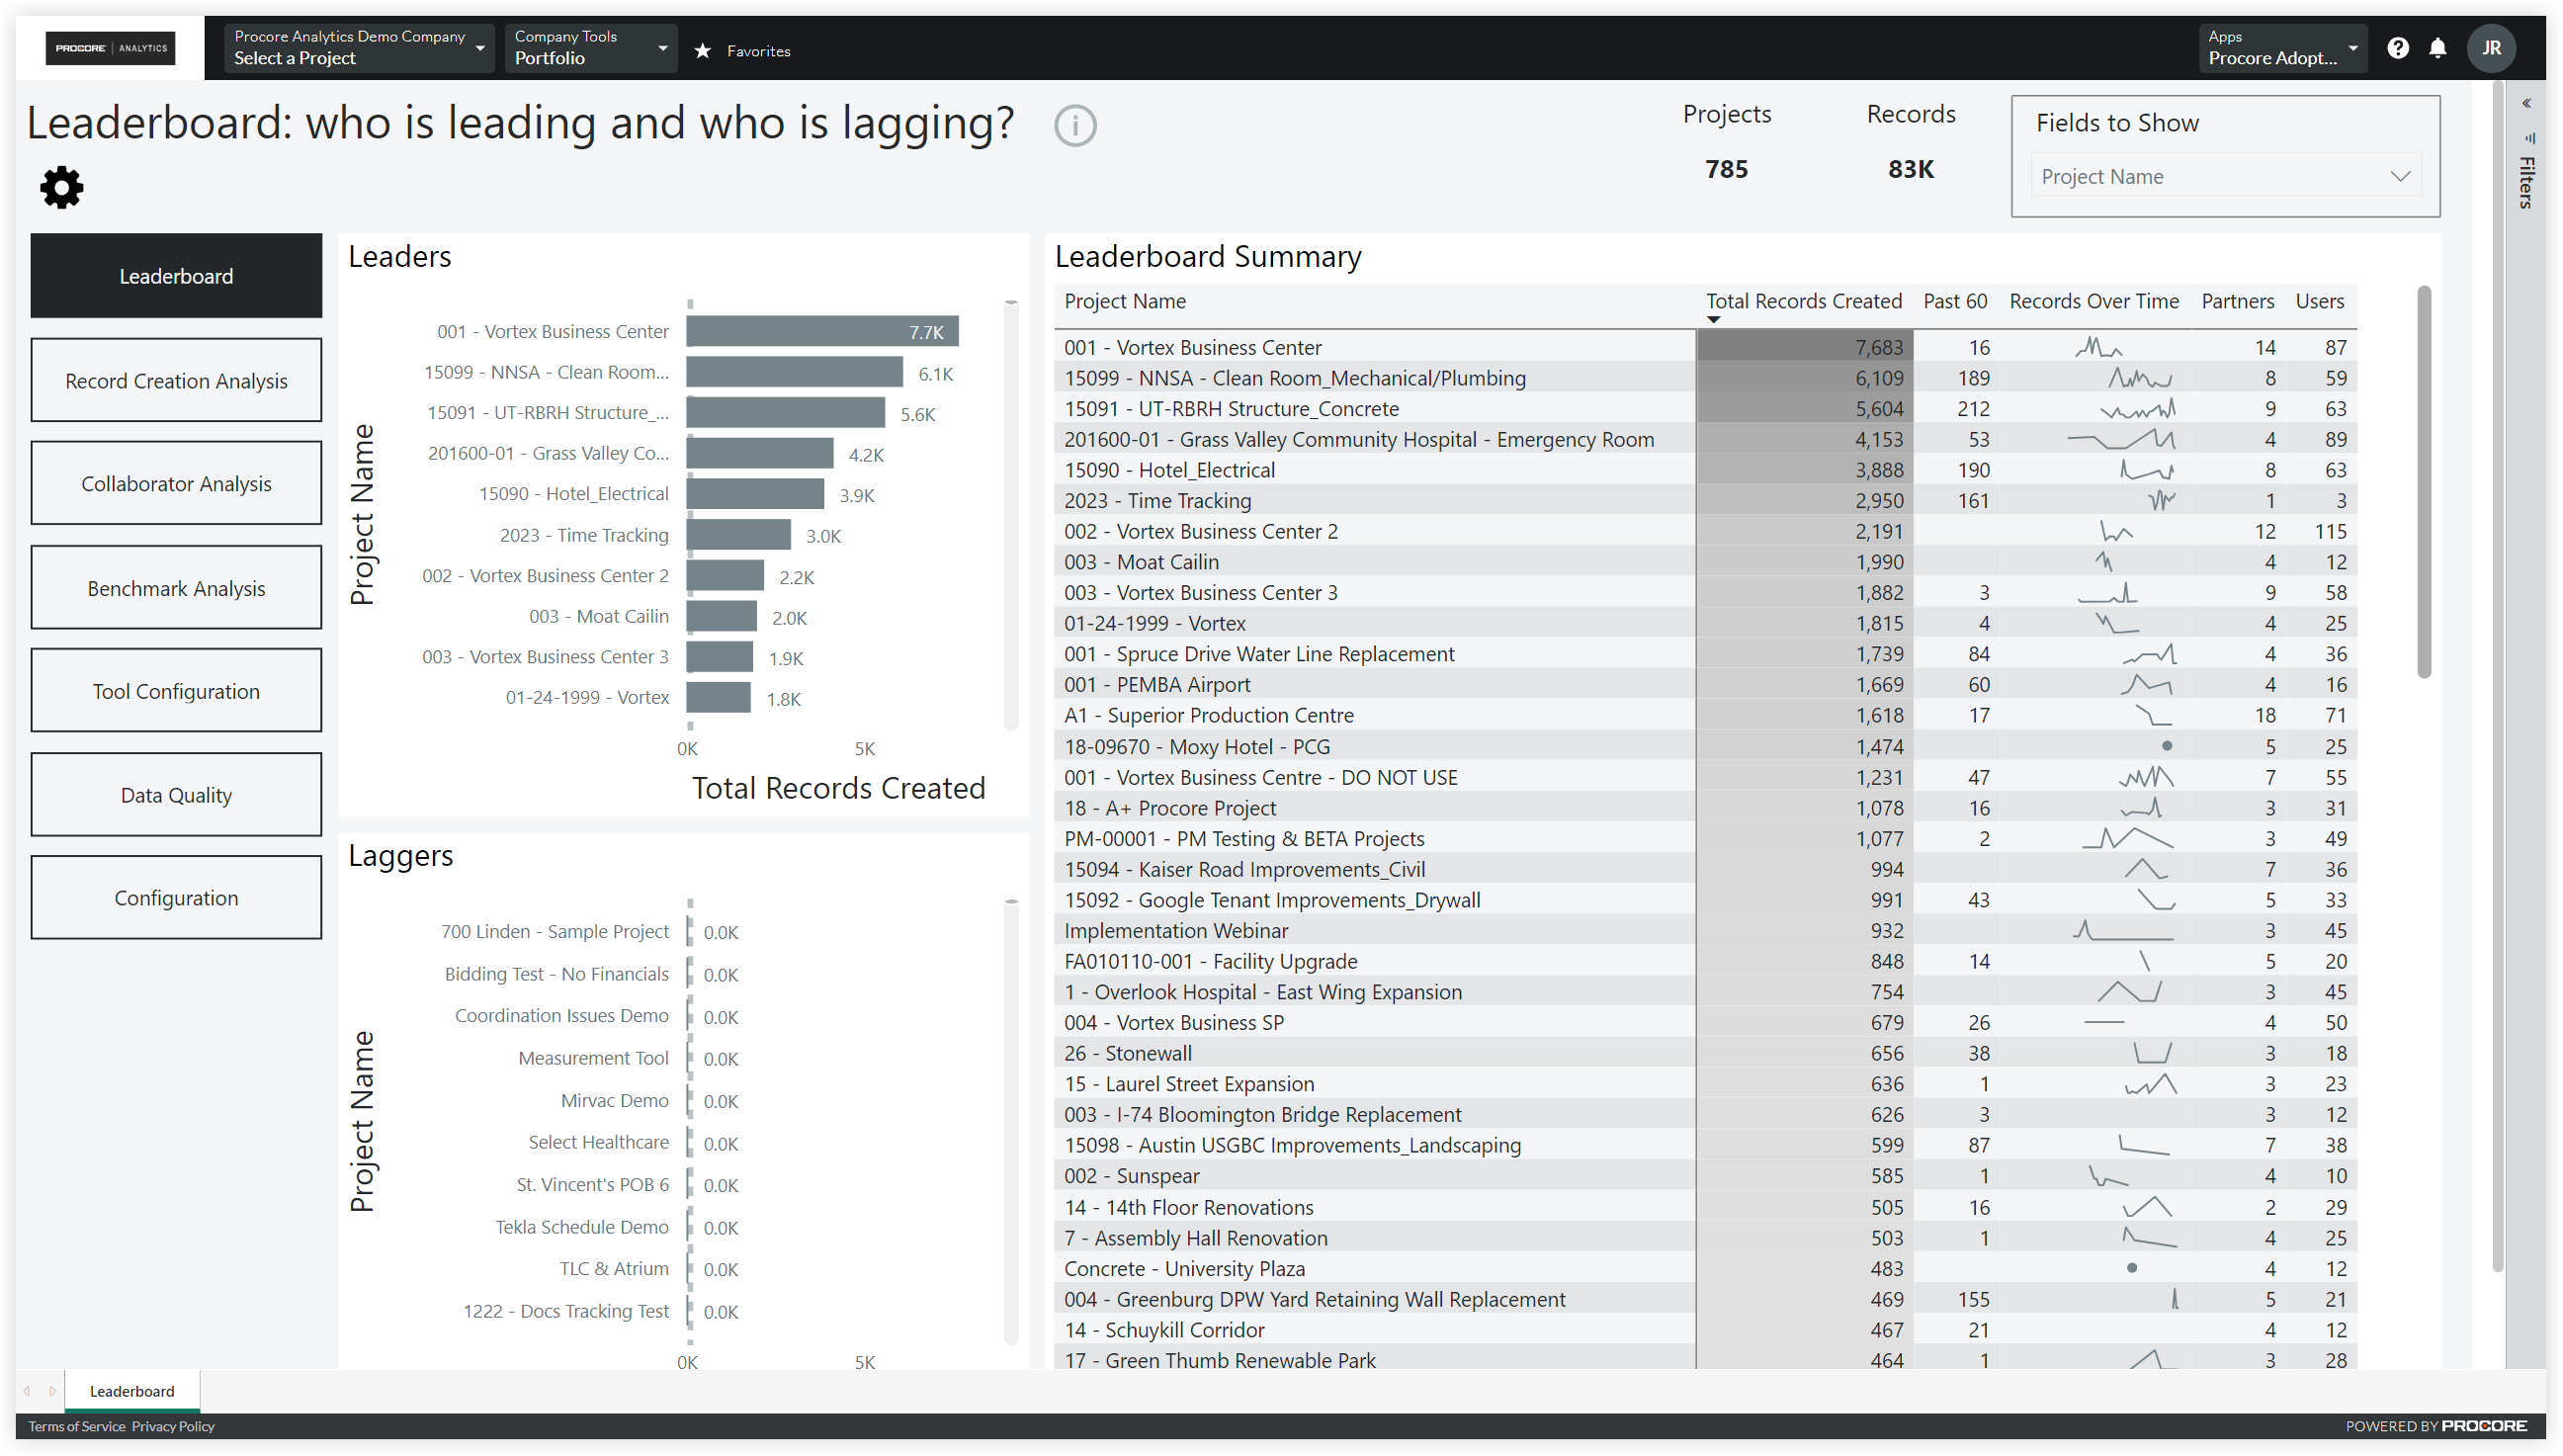
This sample report page was created using mock data for demonstration purposes only.
Record Creation Analysis
Summary
The Record Creation Analysis report page is highly configurable and enables analysis across many predefined metrics. Customers can configure which metric they want to review and analyze the underlying data.
Sample Report Page
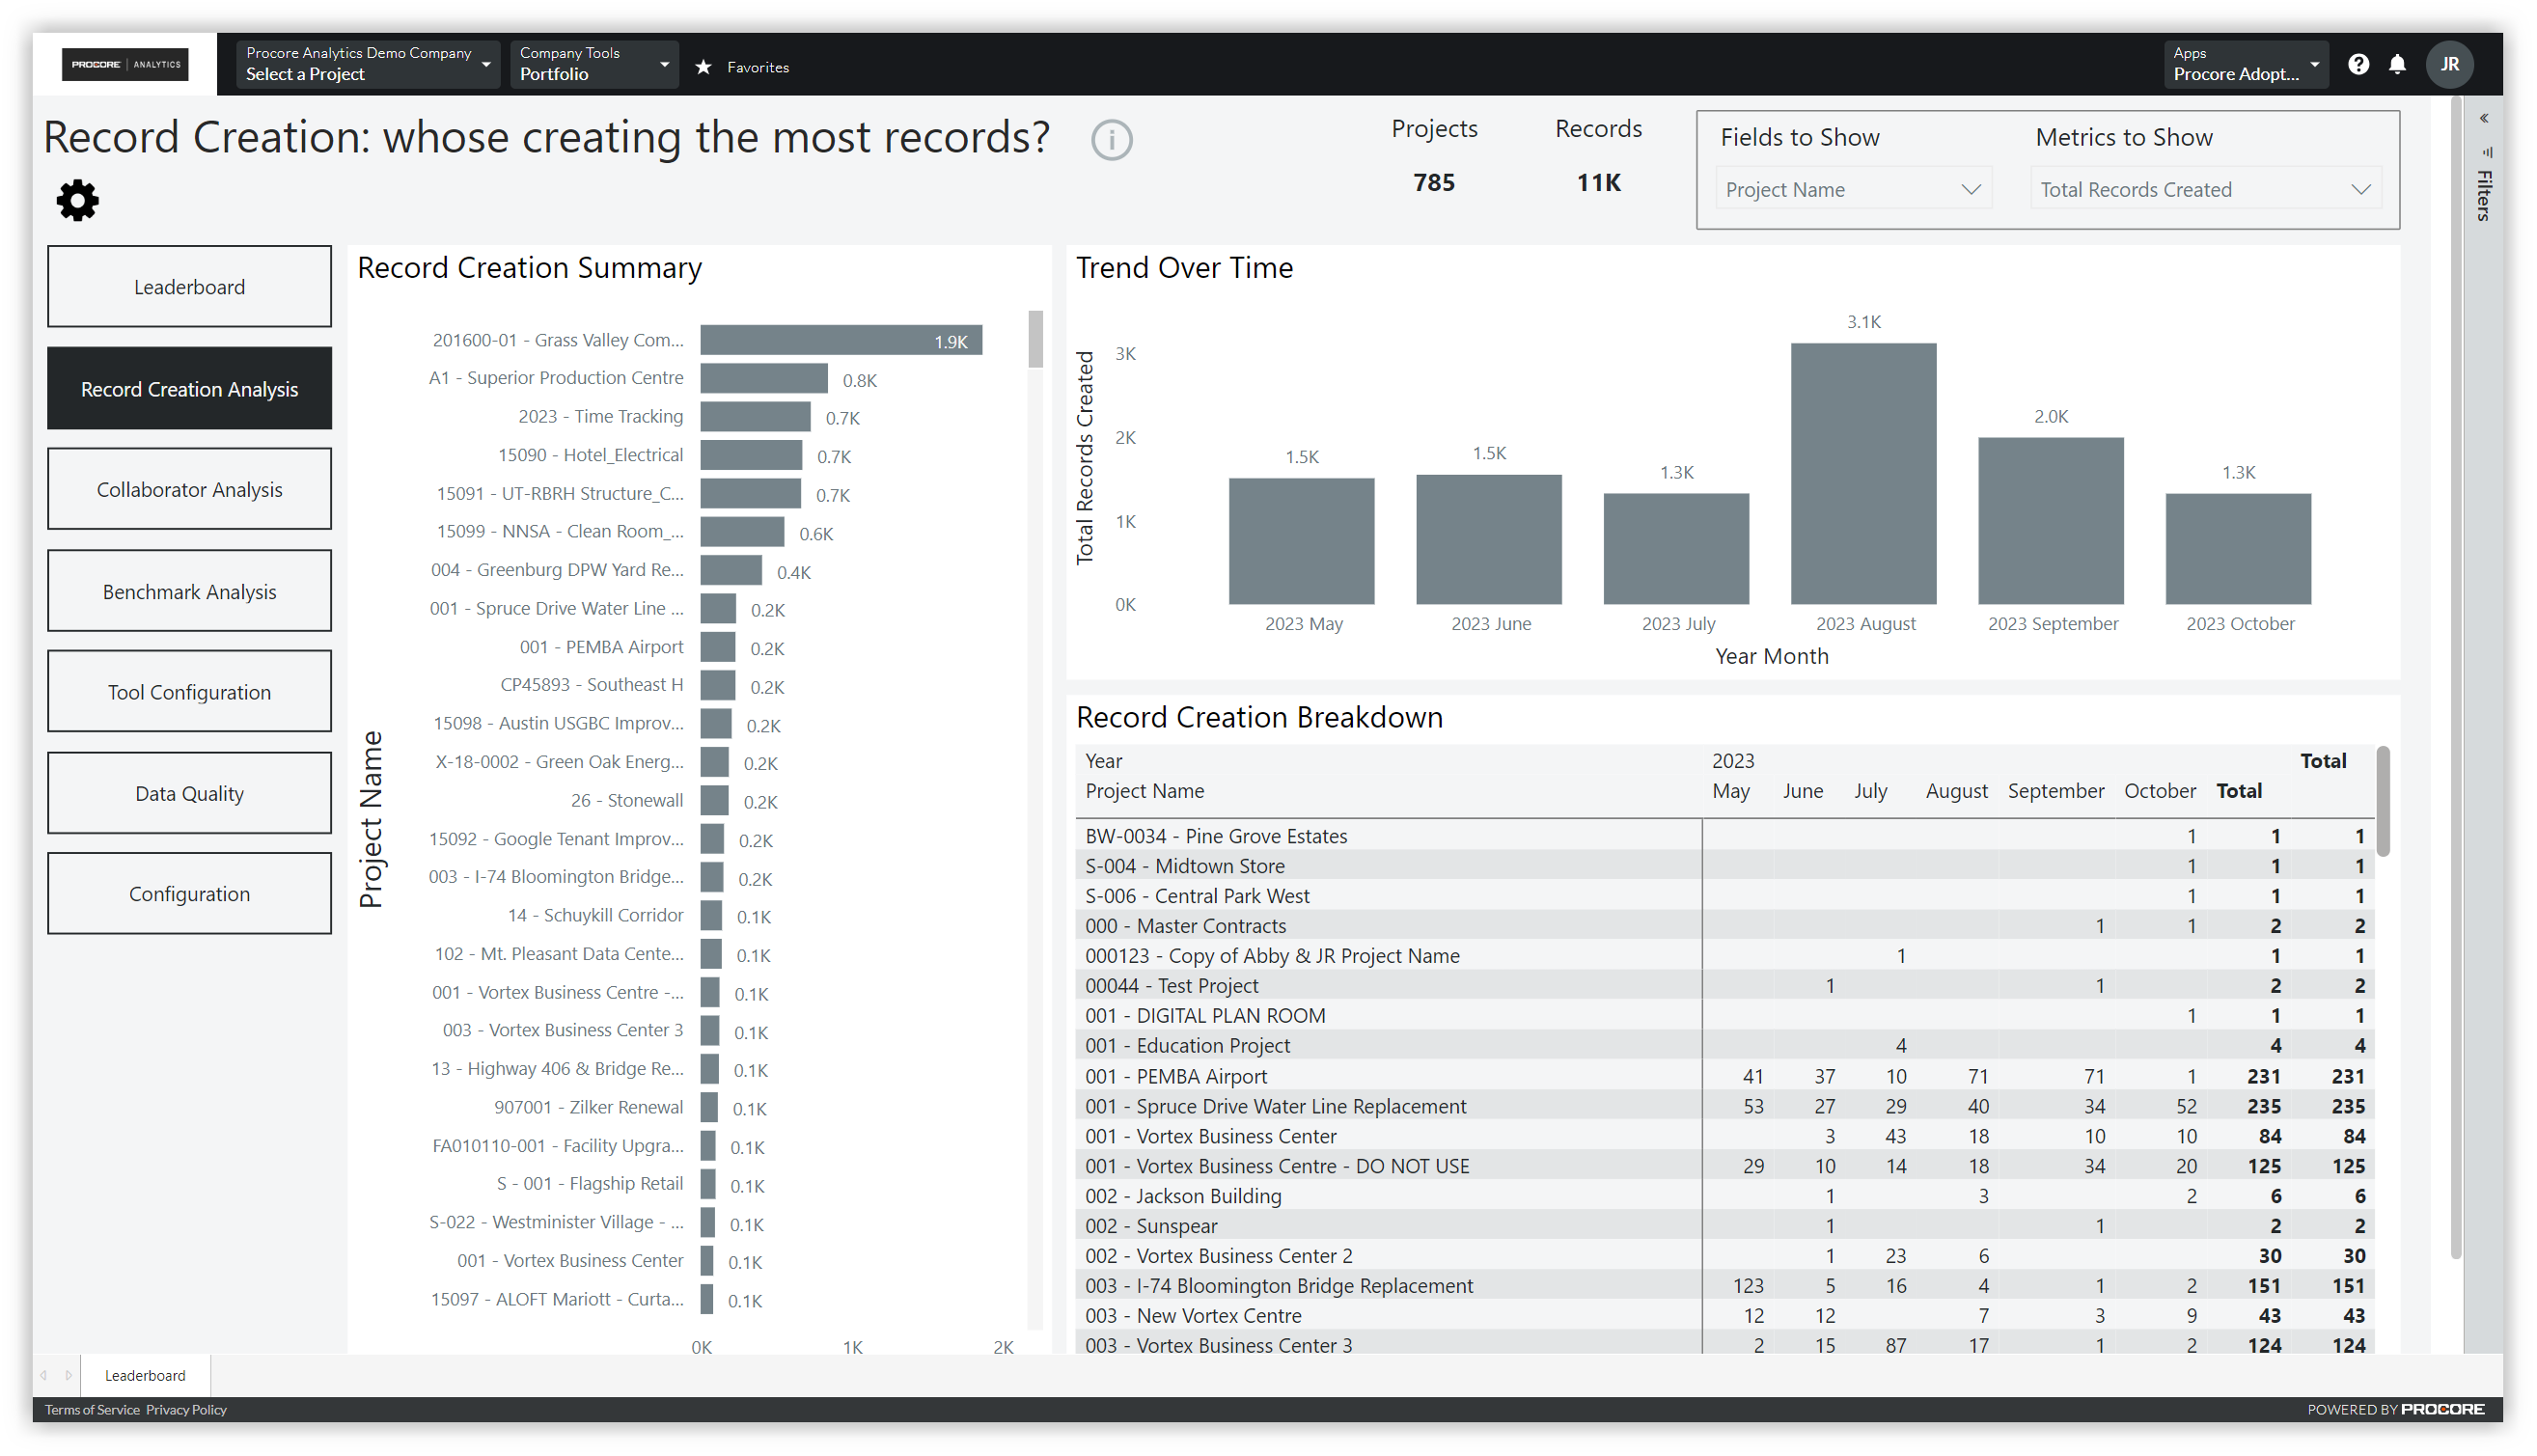
This sample report page was created using mock data for demonstration purposes only.
Collaborator Analysis
Summary
As part of the Procore Adoption Report, the Collaborator Analysis Report lets you analyze how your partners or collaborators are leveraging Procore. The report allows you to define a target KPI, which can be used to measure progress toward your collaborator adoption goals. Overall, this report can be used to guide conversations with your partners to ensure all your business processes and workflows are happening within the Procore platform.
Sample Report Page
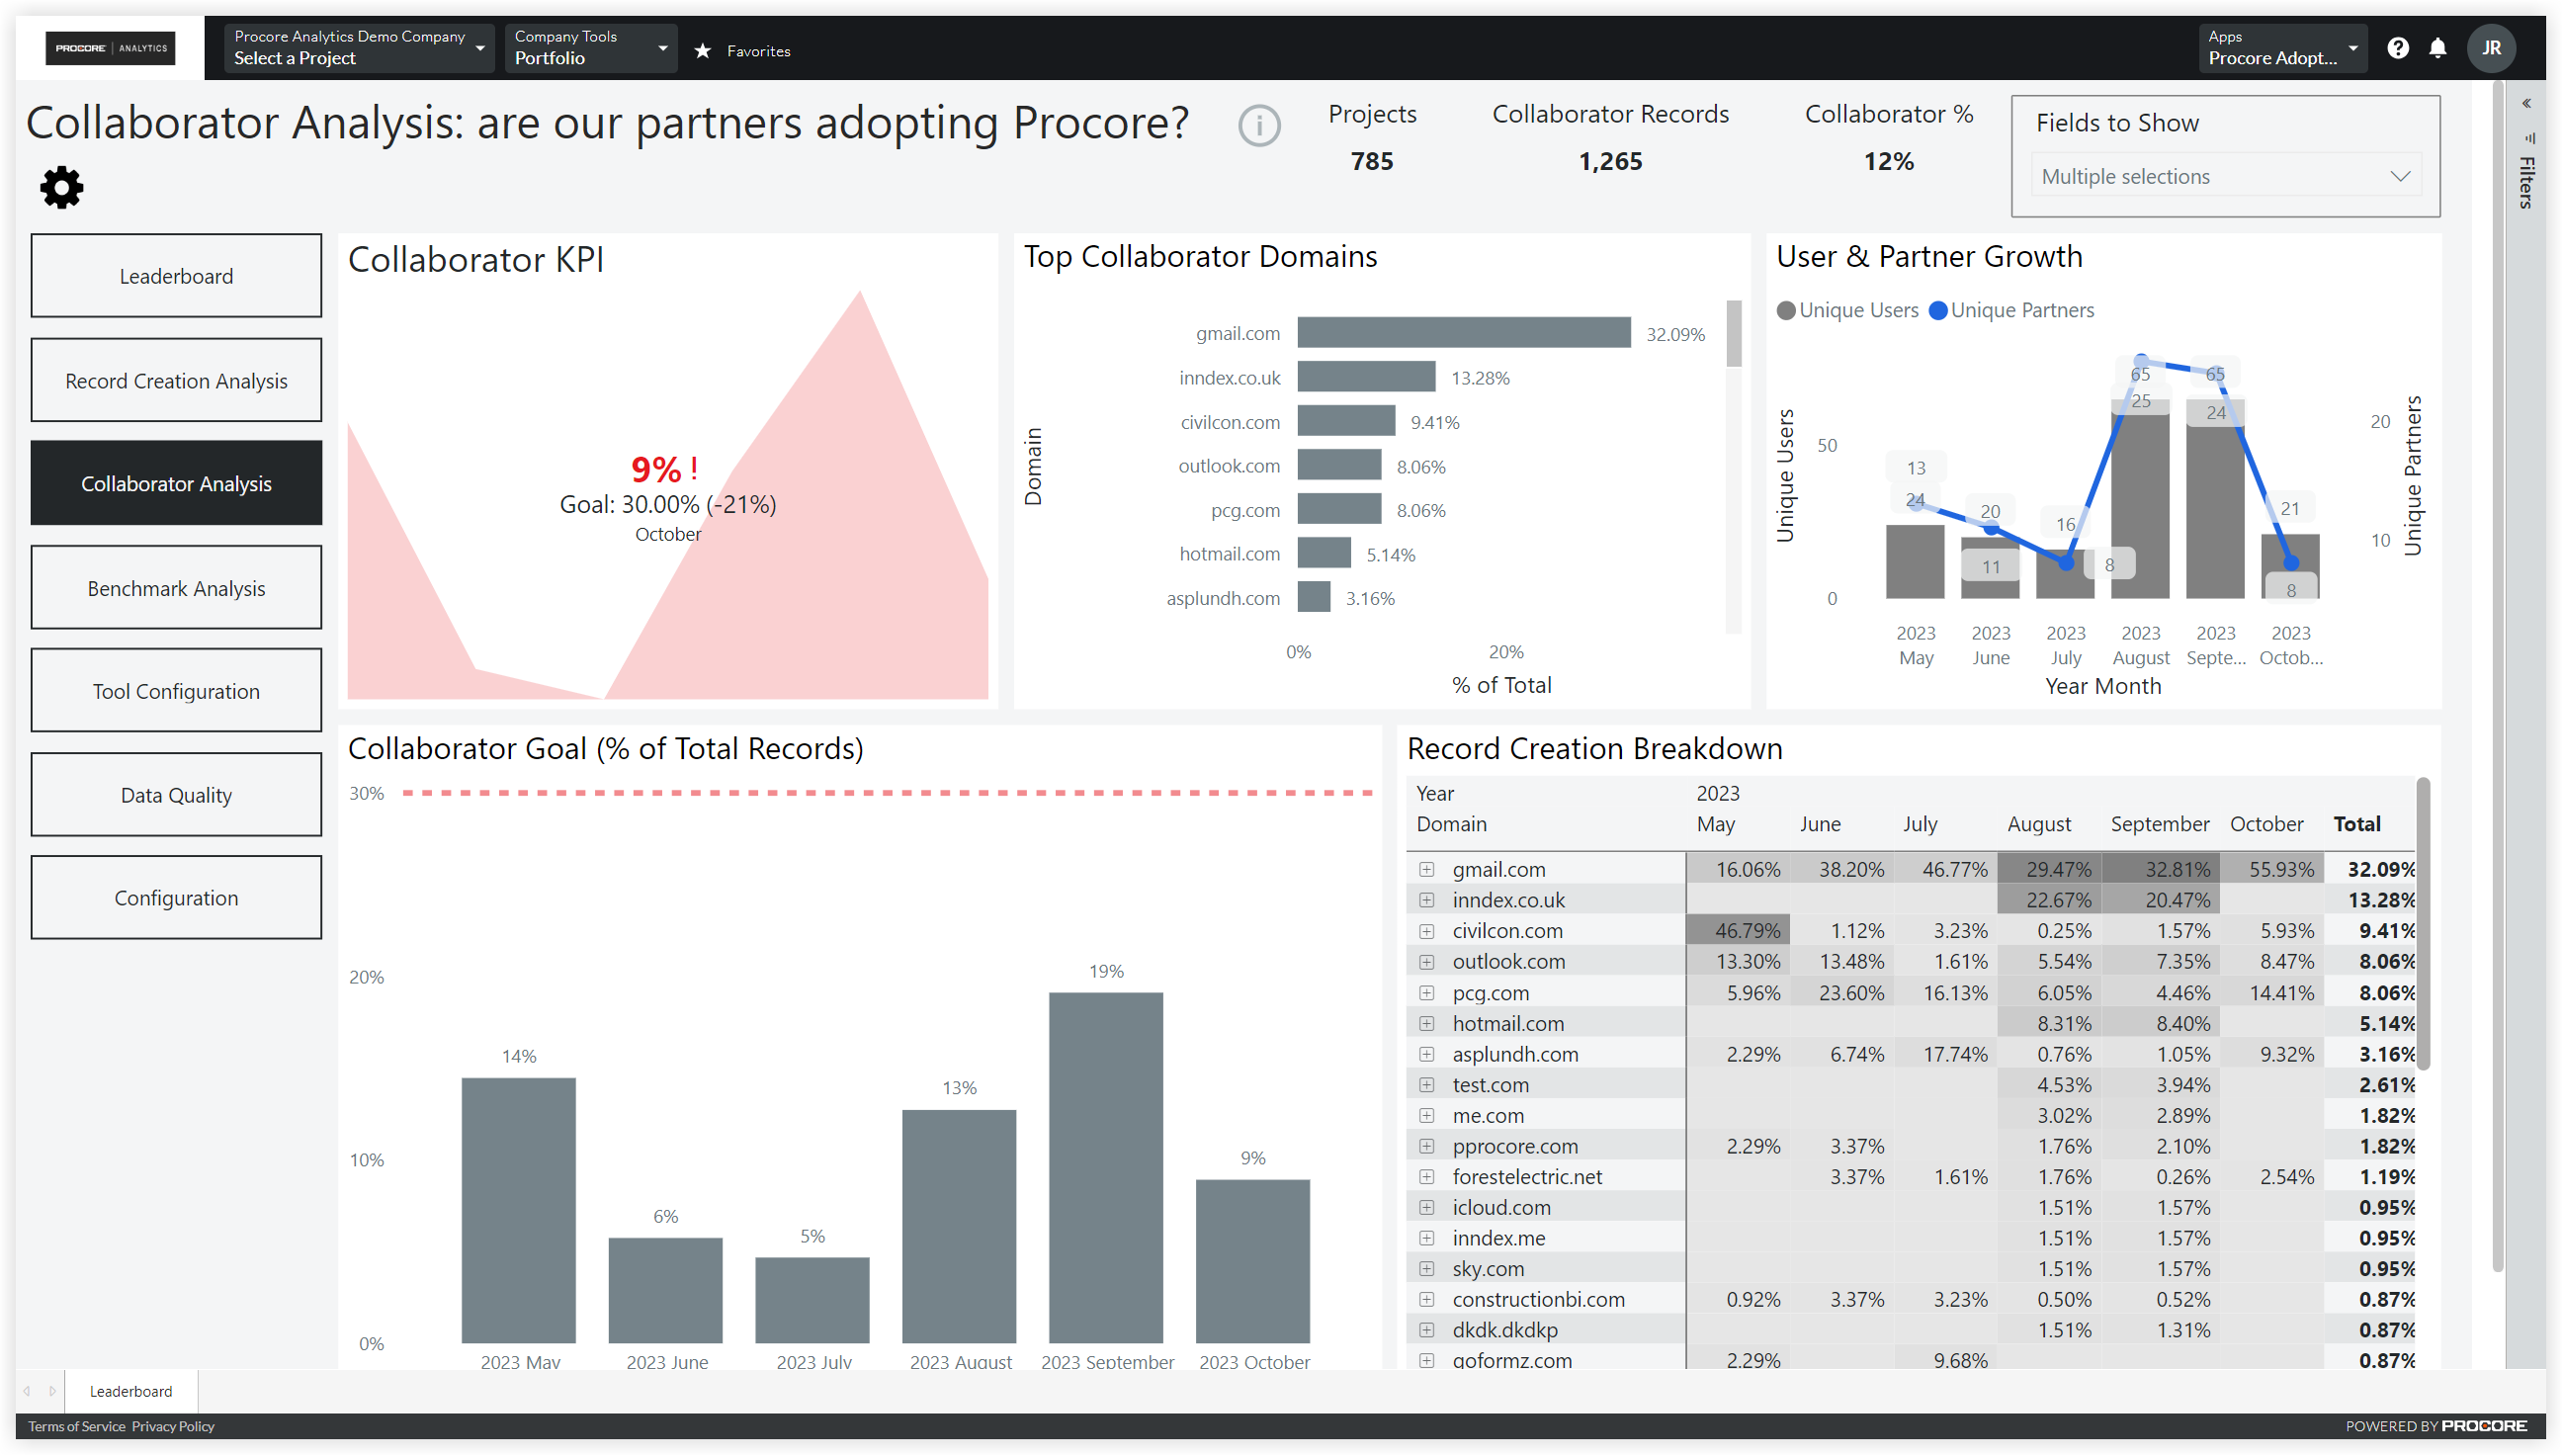
This sample report page was created using mock data for demonstration purposes only.
Benchmark Analysis
Summary
As part of the Procore Analytics Adoption Report, the Benchmark Analysis Report is a highly configurable report that compares one or more projects against a benchmark set of data. The report allows you to compare your initial data set with a benchmark categorized by project, project type, office, square footage, and the project's estimated value. The Benchmark Analysis Reports can also help you see if an ongoing project is producing data in a way similar to past projects of the same type.
Sample Report Page
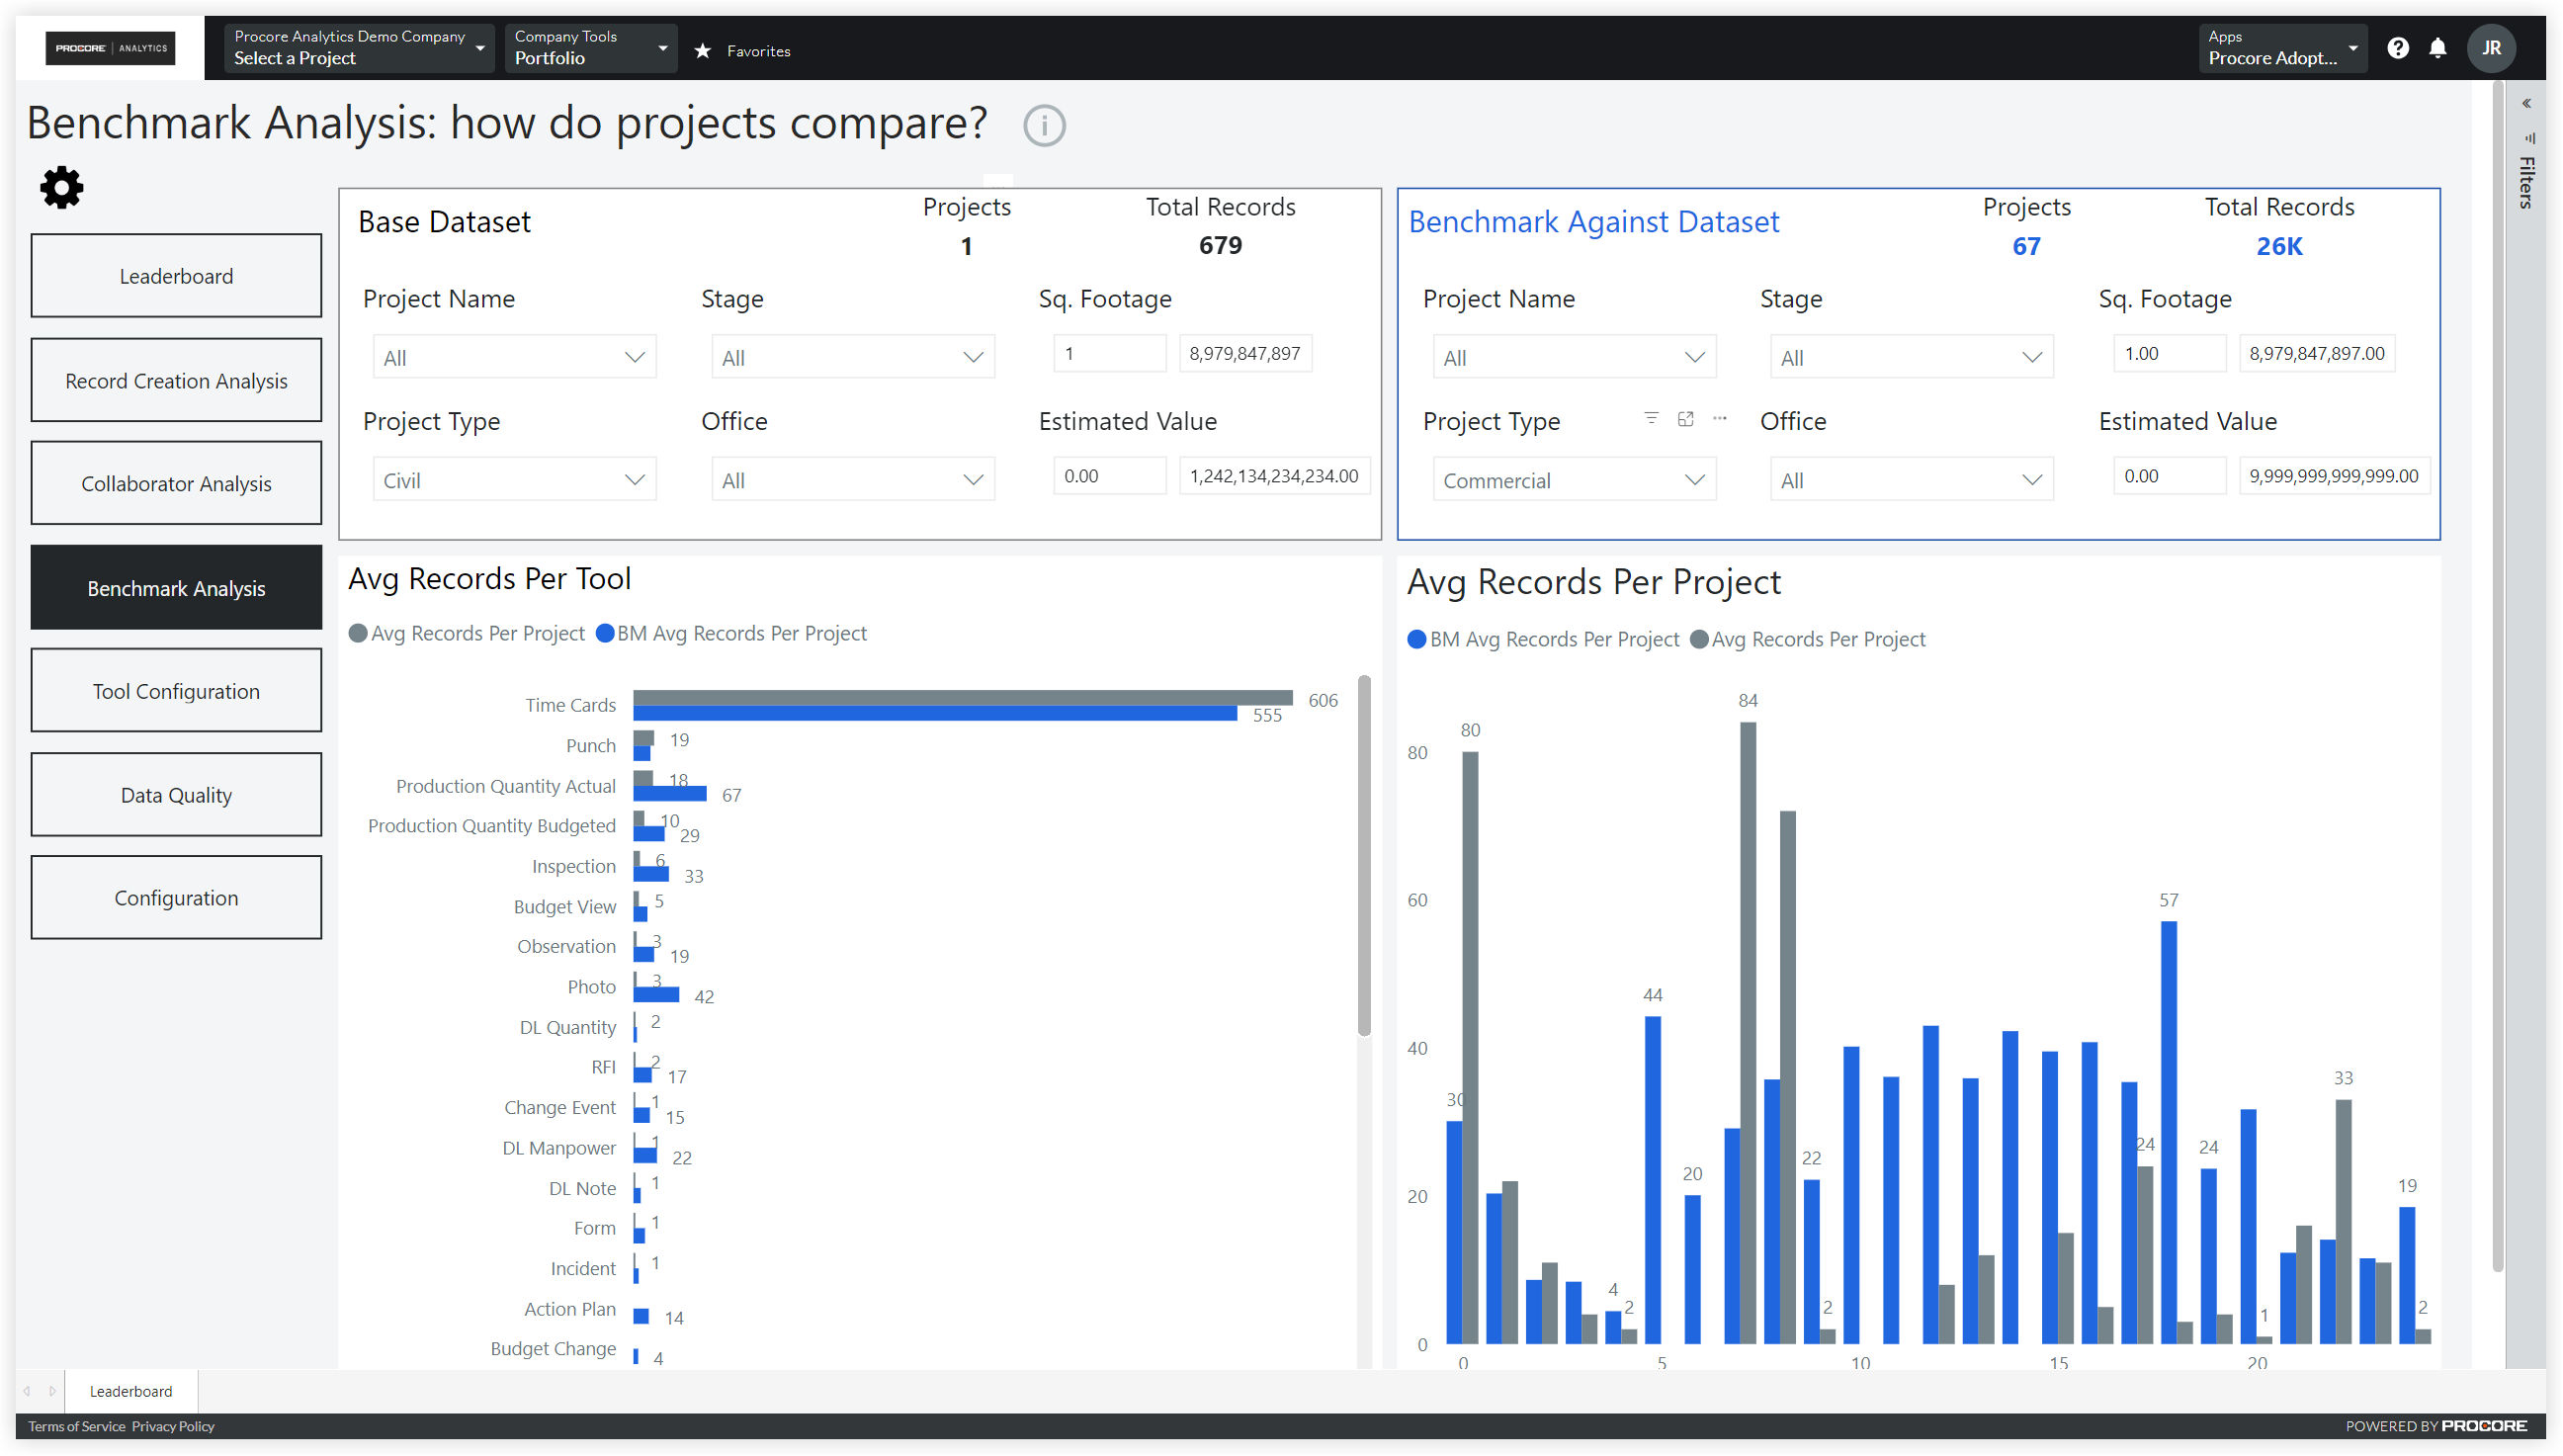
This sample report page was created using mock data for demonstration purposes only.
Tool Configuration
Summary
This report is very similar to the old Tool Configuration page found in the Procore Core report. This page enables the user to understand the consistency of tools as they are rolled out across their portfolio of projects.
Sample Report Page
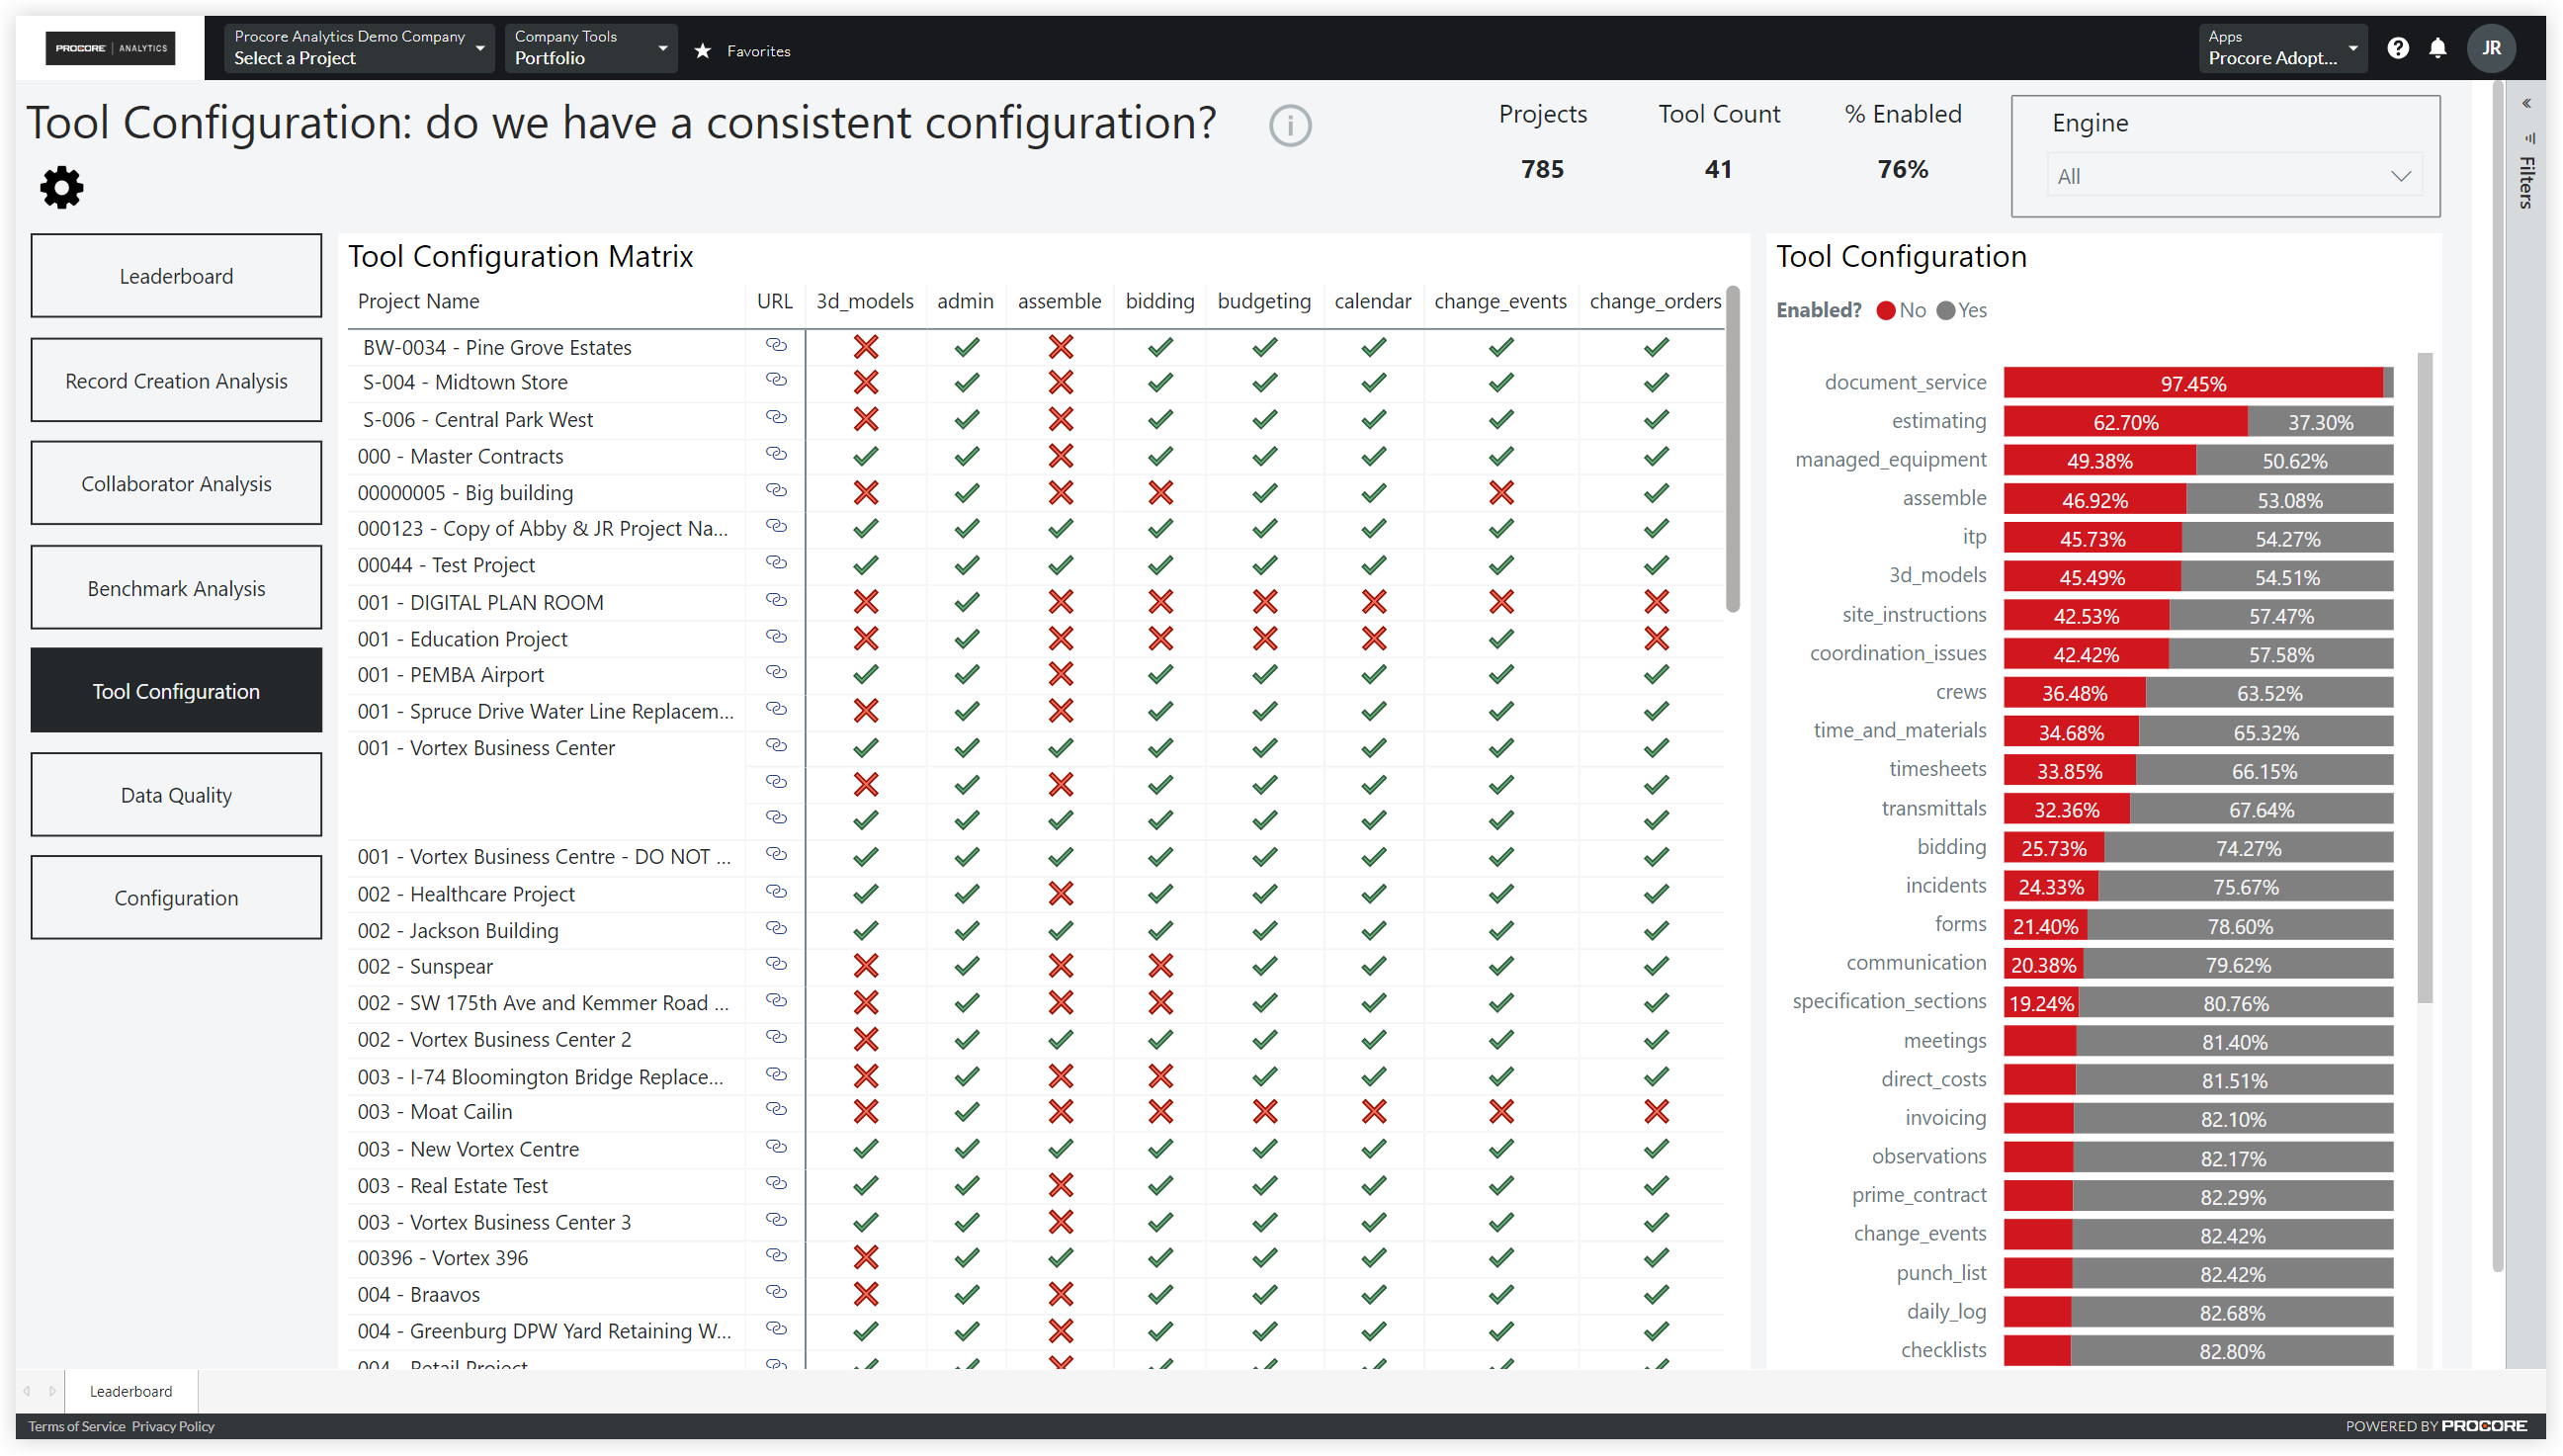
This sample report page was created using mock data for demonstration purposes only.
Data Quality
Summary
The Data Quality report page enables the user to understand data quality metrics on their project records. The report gives them quick insights and helps them quickly address missing data. By filling in missing values, additional capabilities such as benchmarking and trend analysis across Procore Analytics are possible.
Sample Report Page
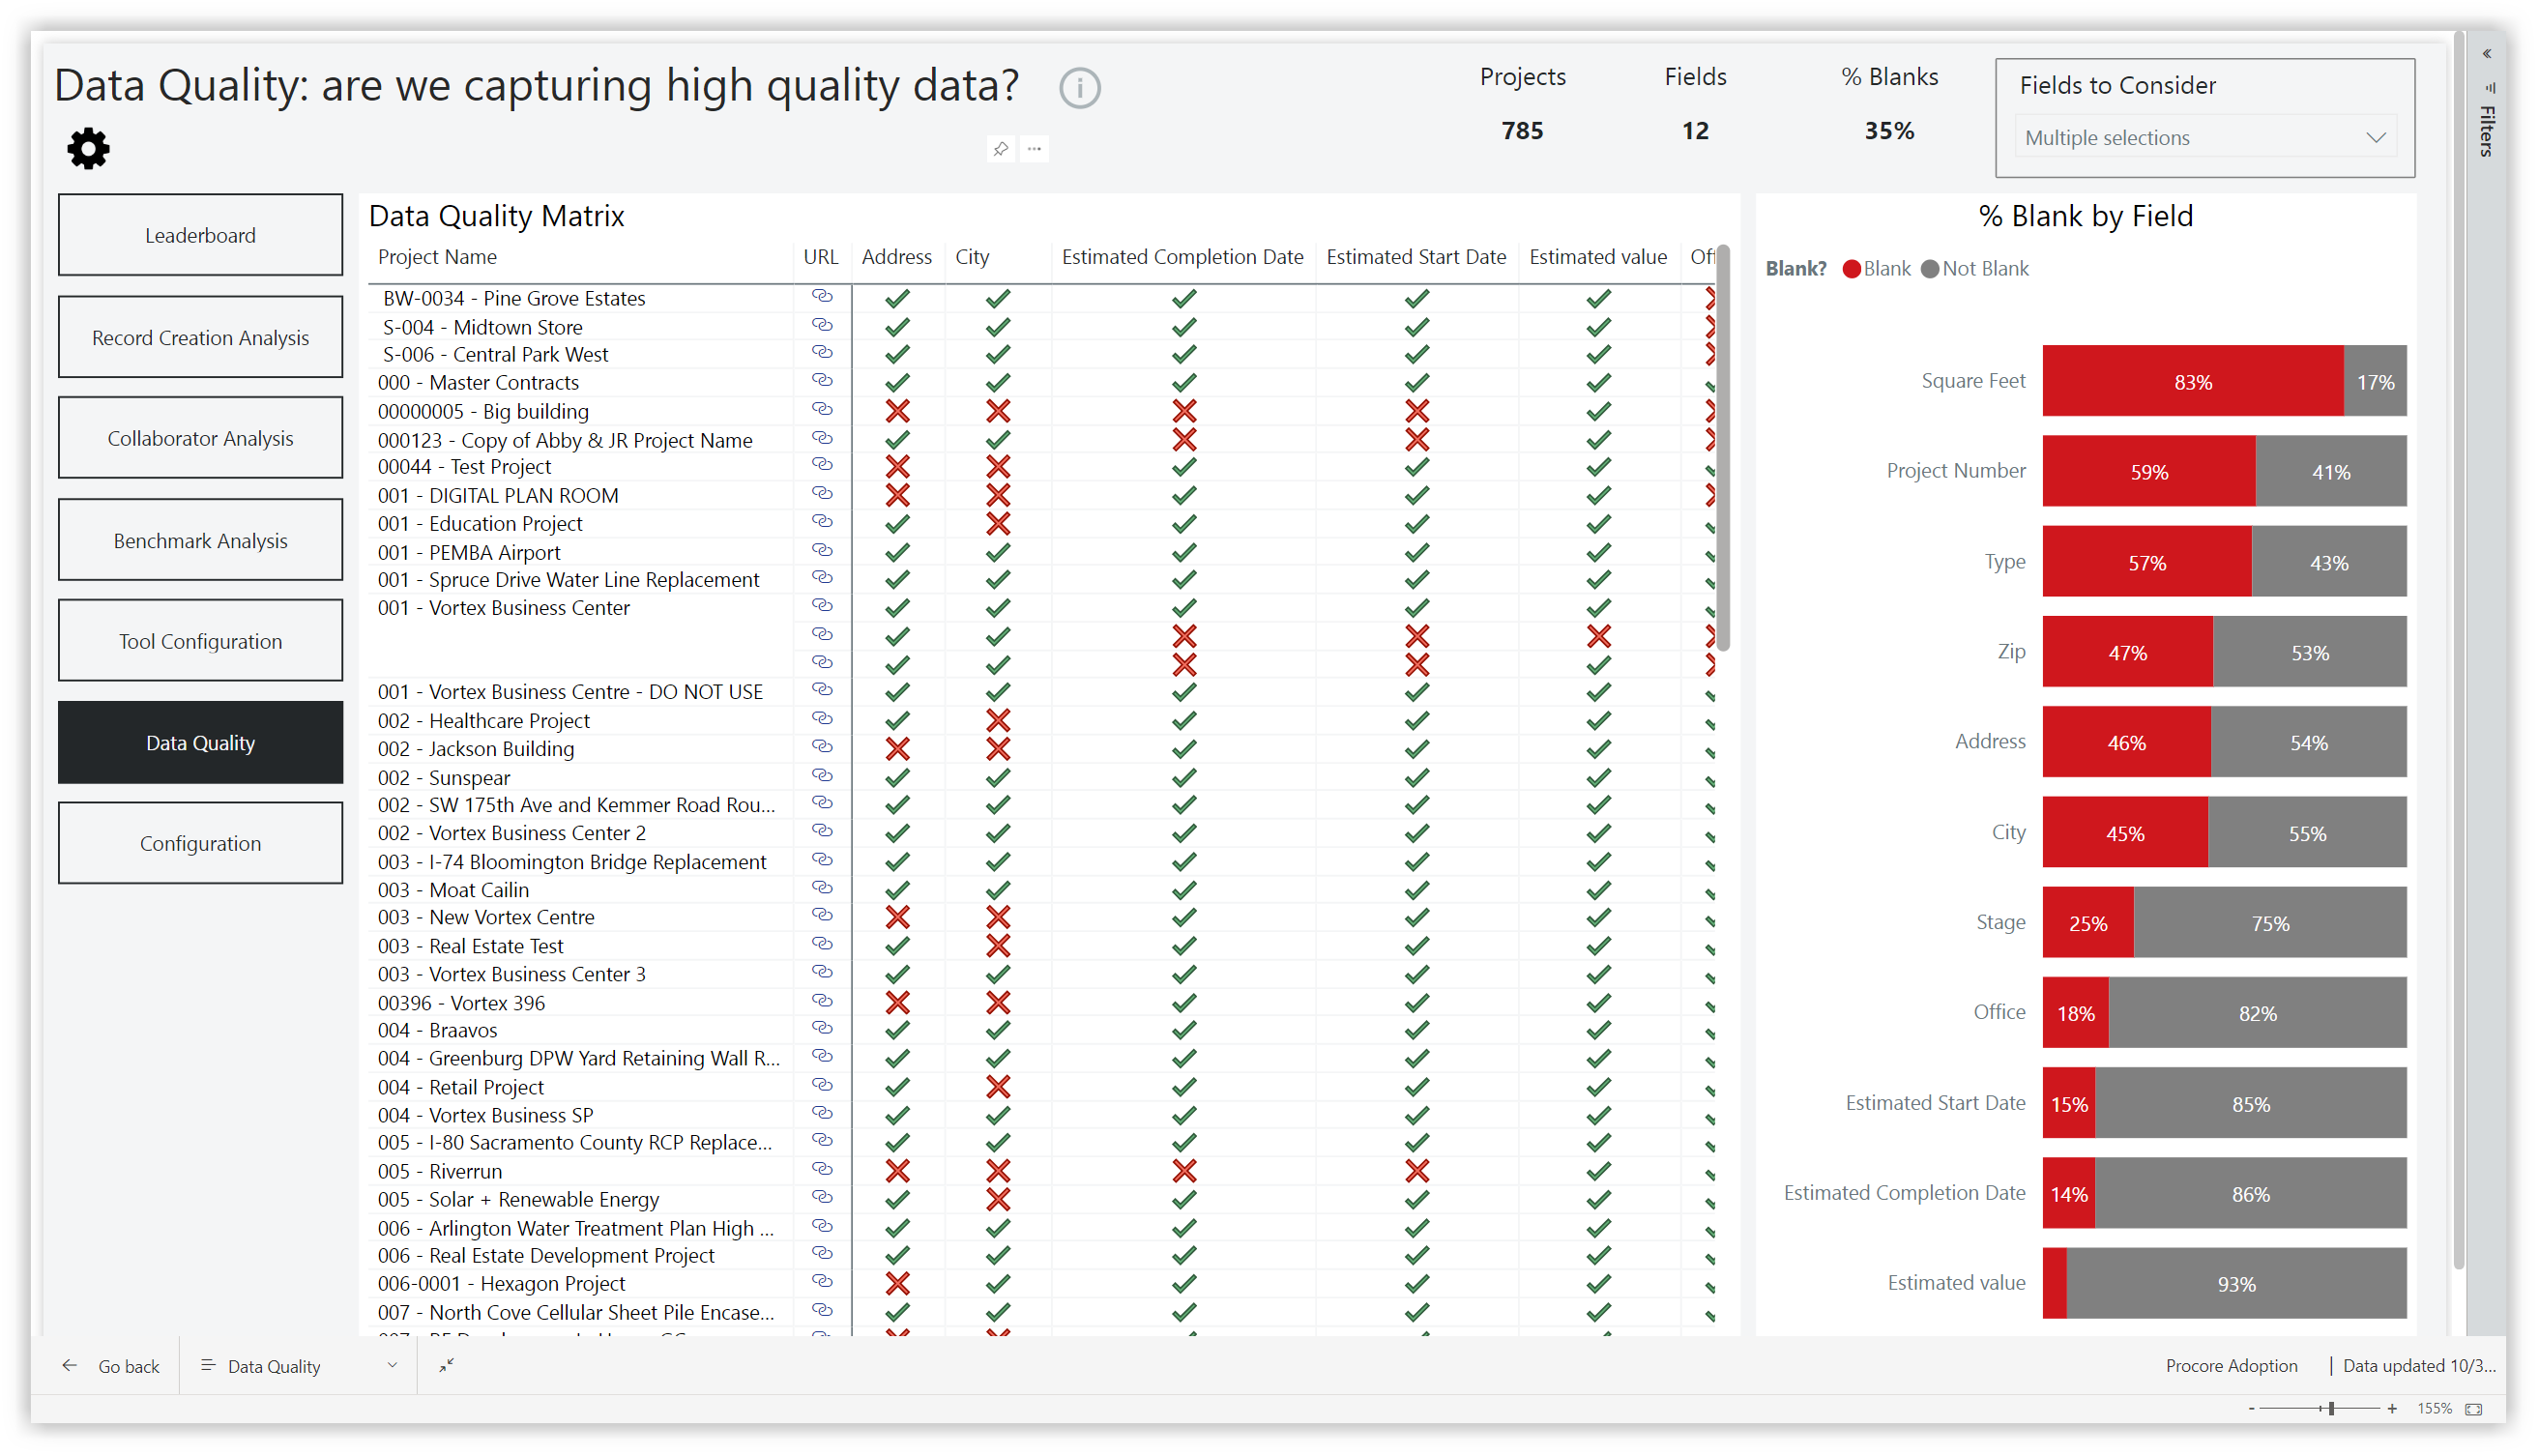
This sample report page was created using mock data for demonstration purposes only.
Configuration
Summary
The Configuration report page has a number of configuration options that can be selected. These include: tools to report usage on, email domains, and collaborator record creation %. See Configure the Procore Analytics Adoption Report.
Sample Report Page
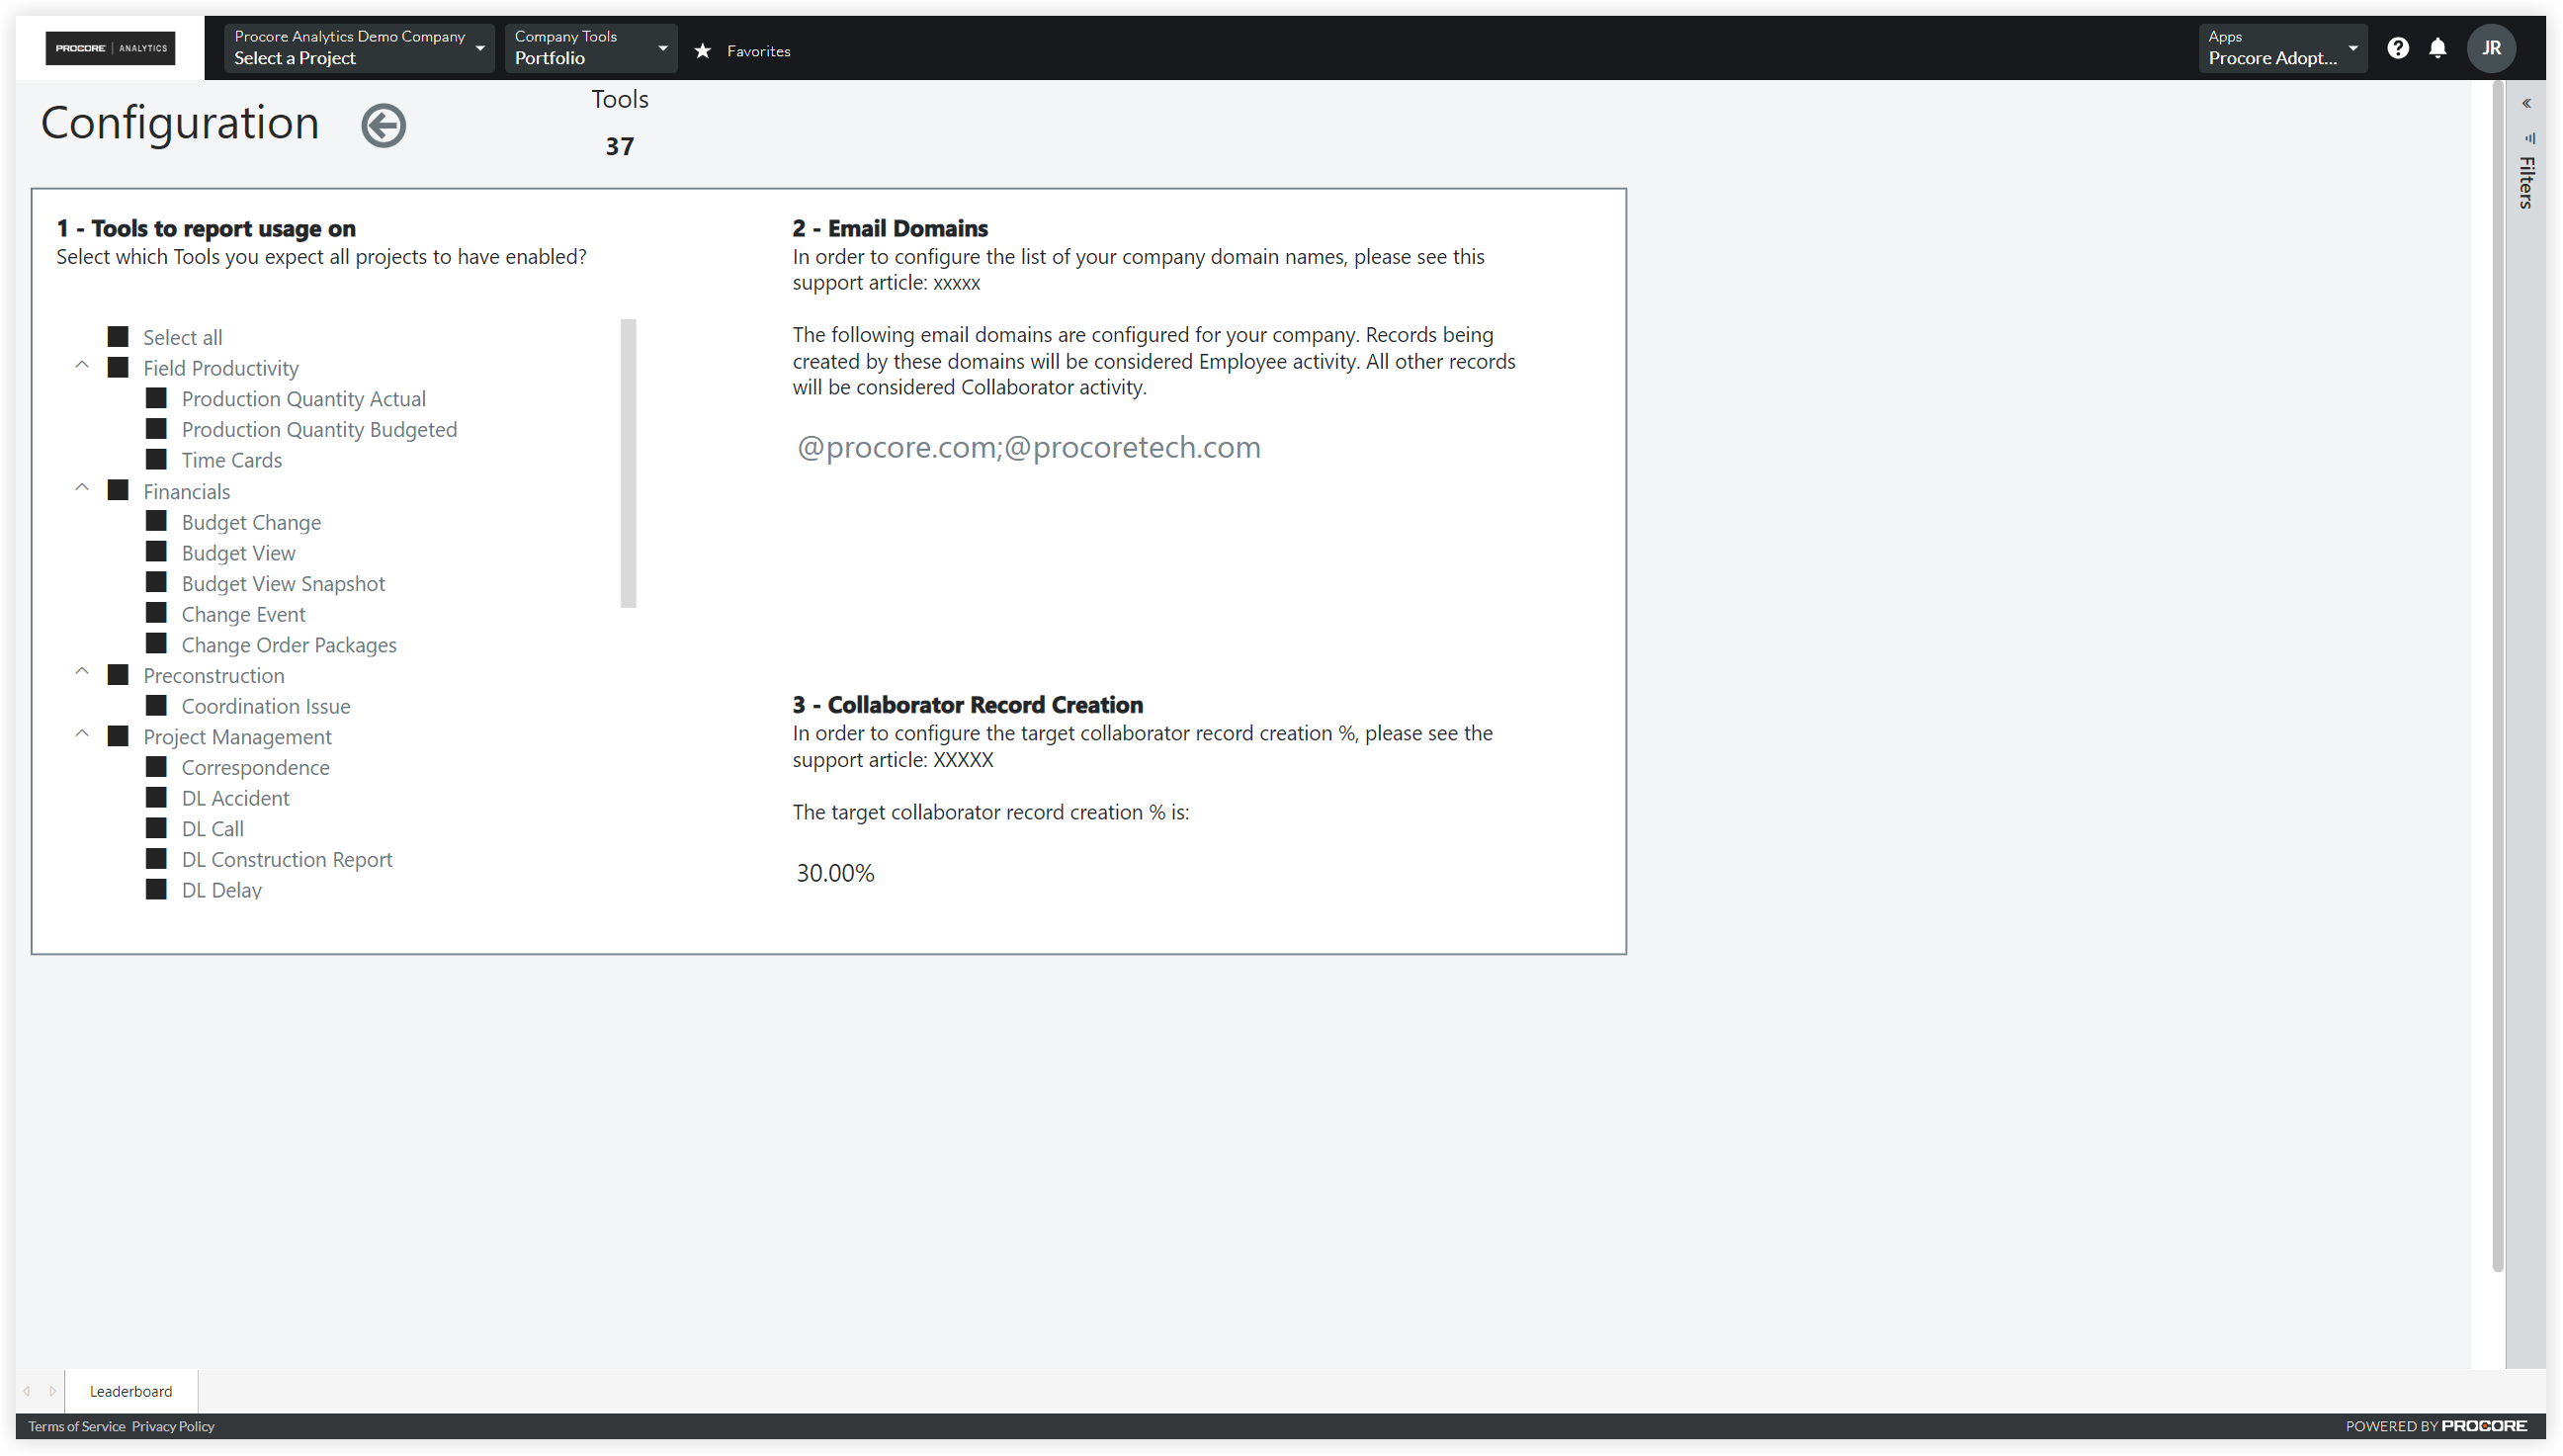
This sample report page was created using mock data for demonstration purposes only.